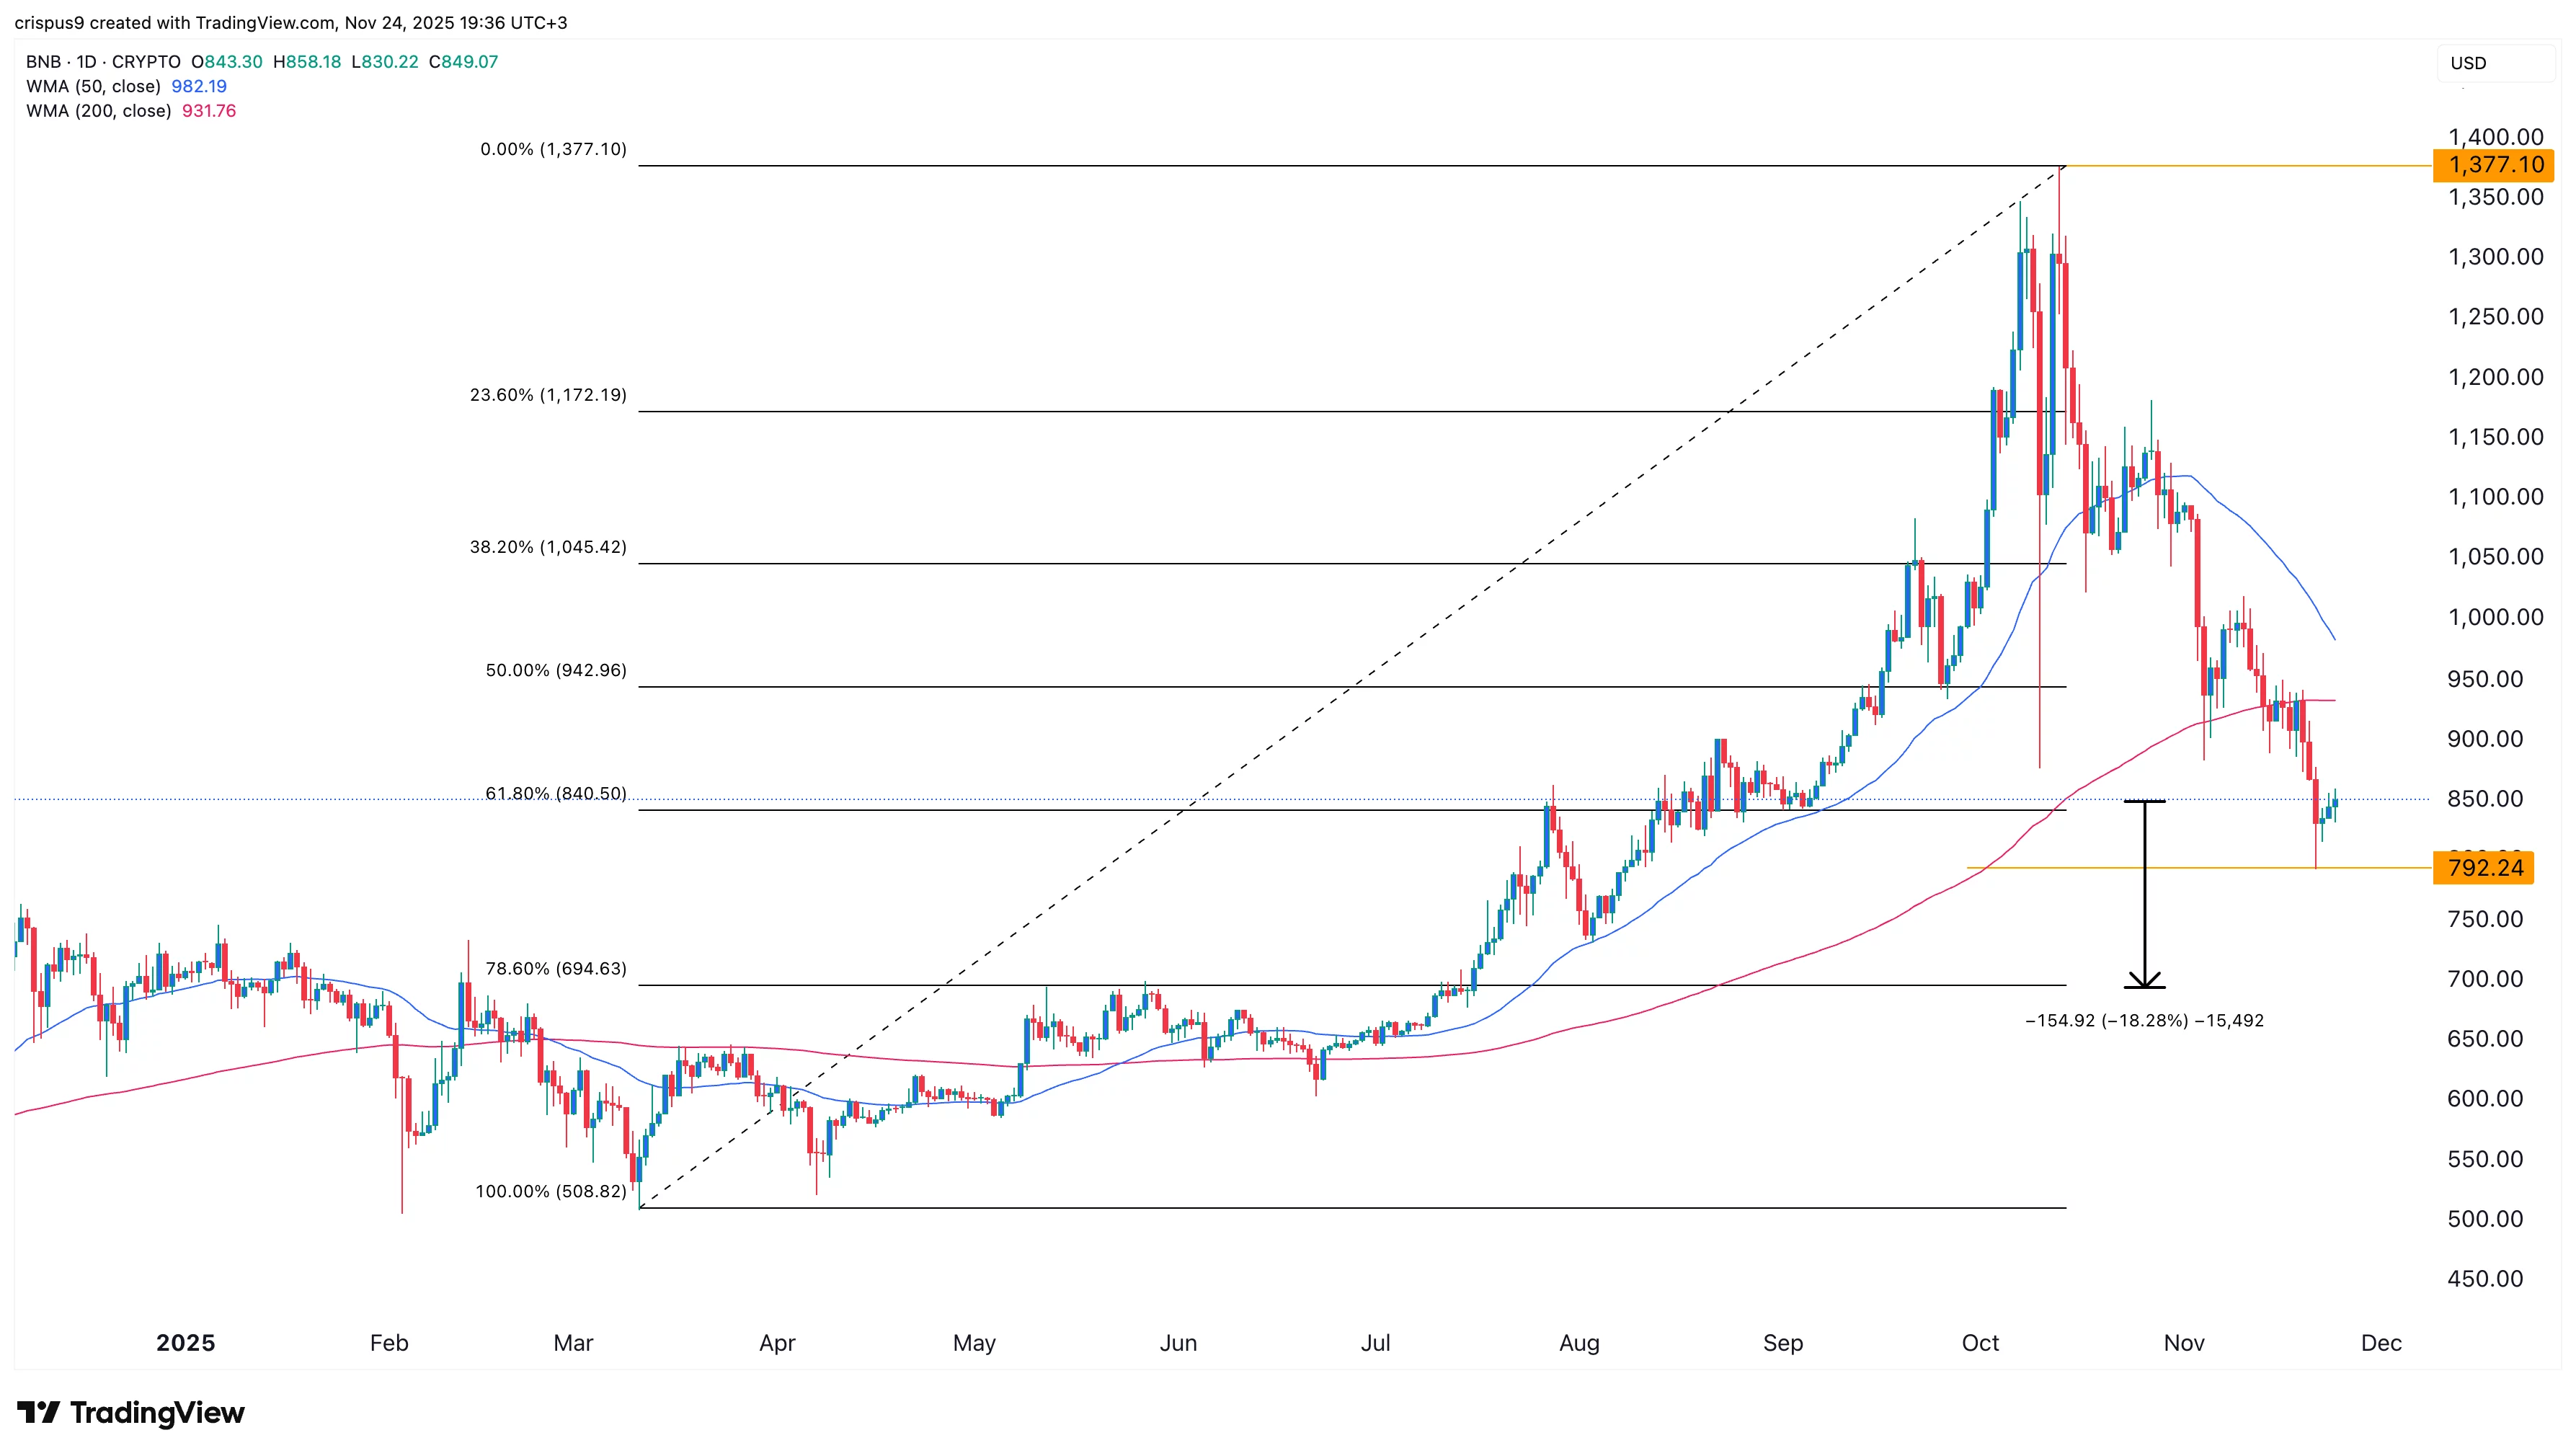
Binance Coin’s price remains in a technical bear market after falling nearly 40% from its year-to-date high.
Summary
- Binance Coin price has plunged by 40% from the year-to-date high.
- The coin is about to form a death cross pattern on the daily chart.
- Nansen data shows that the number of transactions has plunged.
Binance Coin (BNB) traded at $847 on Monday, a few points above its lowest level this month. This crash has brought its market cap from nearly $190 billion to $116 billion today.
The BNB price has plunged amid the ongoing crypto market crash that has affected Bitcoin (BTC) and most altcoins. It also happened amid deteriorating fundamentals in its network.
Data compiled by Nansen shows that the number of transactions on the BSC Chain has plunged by 63% in the last 30 days to 486 million. This is its worst 30-day drop in months.
The number of active addresses in the BSC Chain has dropped by 2.9% in the last 30 days to 36.5 million. Most importantly, the network’s fee collection dropped by 72% to $19.2 million.
BSC’s activity is a sharp contrast to that of other chains in the crypto industry. Base’s transactions jumped by 108% in the last 30 days to 397 million, while Polygon and Avalanche soared by 80% and 54% to 135 million and 62 million, respectively.
More data shows that, while the amount of stablecoins in the BSC Chain rose to $14.2 billion, the adjusted transaction volume dropped by 34% in the last 30 days to $204.2 billion.
Binance Coin price technical analysis

The daily chart shows that the BNB price has remained under pressure in the past few months. It has plunged from the all-time high of $1,377 to the current $850.
The coin is hovering at the 61.8% Fibonacci Retracement level. Worse, it is about to form the risky death cross pattern, which happens when the 50-day and 200-day Weighted Moving Averages cross each other.
In this case, the 50-day WMA is at $982, while the 200-day WMA is at $930. Also, the coin has dropped below the Supertrend and the Ichimoku cloud indicators.
Therefore, the most likely BNB price forecast is bearish, with the next key target being at $695, the 78.6% retracement level. This target is about 18.2% below the current level.

Source link

