


Can Bitcoin regain momentum after forming a death cross, or will the setup echo the extended weakness seen in 2022?
Summary
- Bitcoin has formed a death cross after falling below its 50-day and 200-day moving averages.
- Analyst Ali Martinez points to historical cycles and MVRV data to outline possible lower levels if weakness continues.
- Egrag Crypto disagrees, arguing that moving averages have lost reliability and that the market remains intact above long-term support.
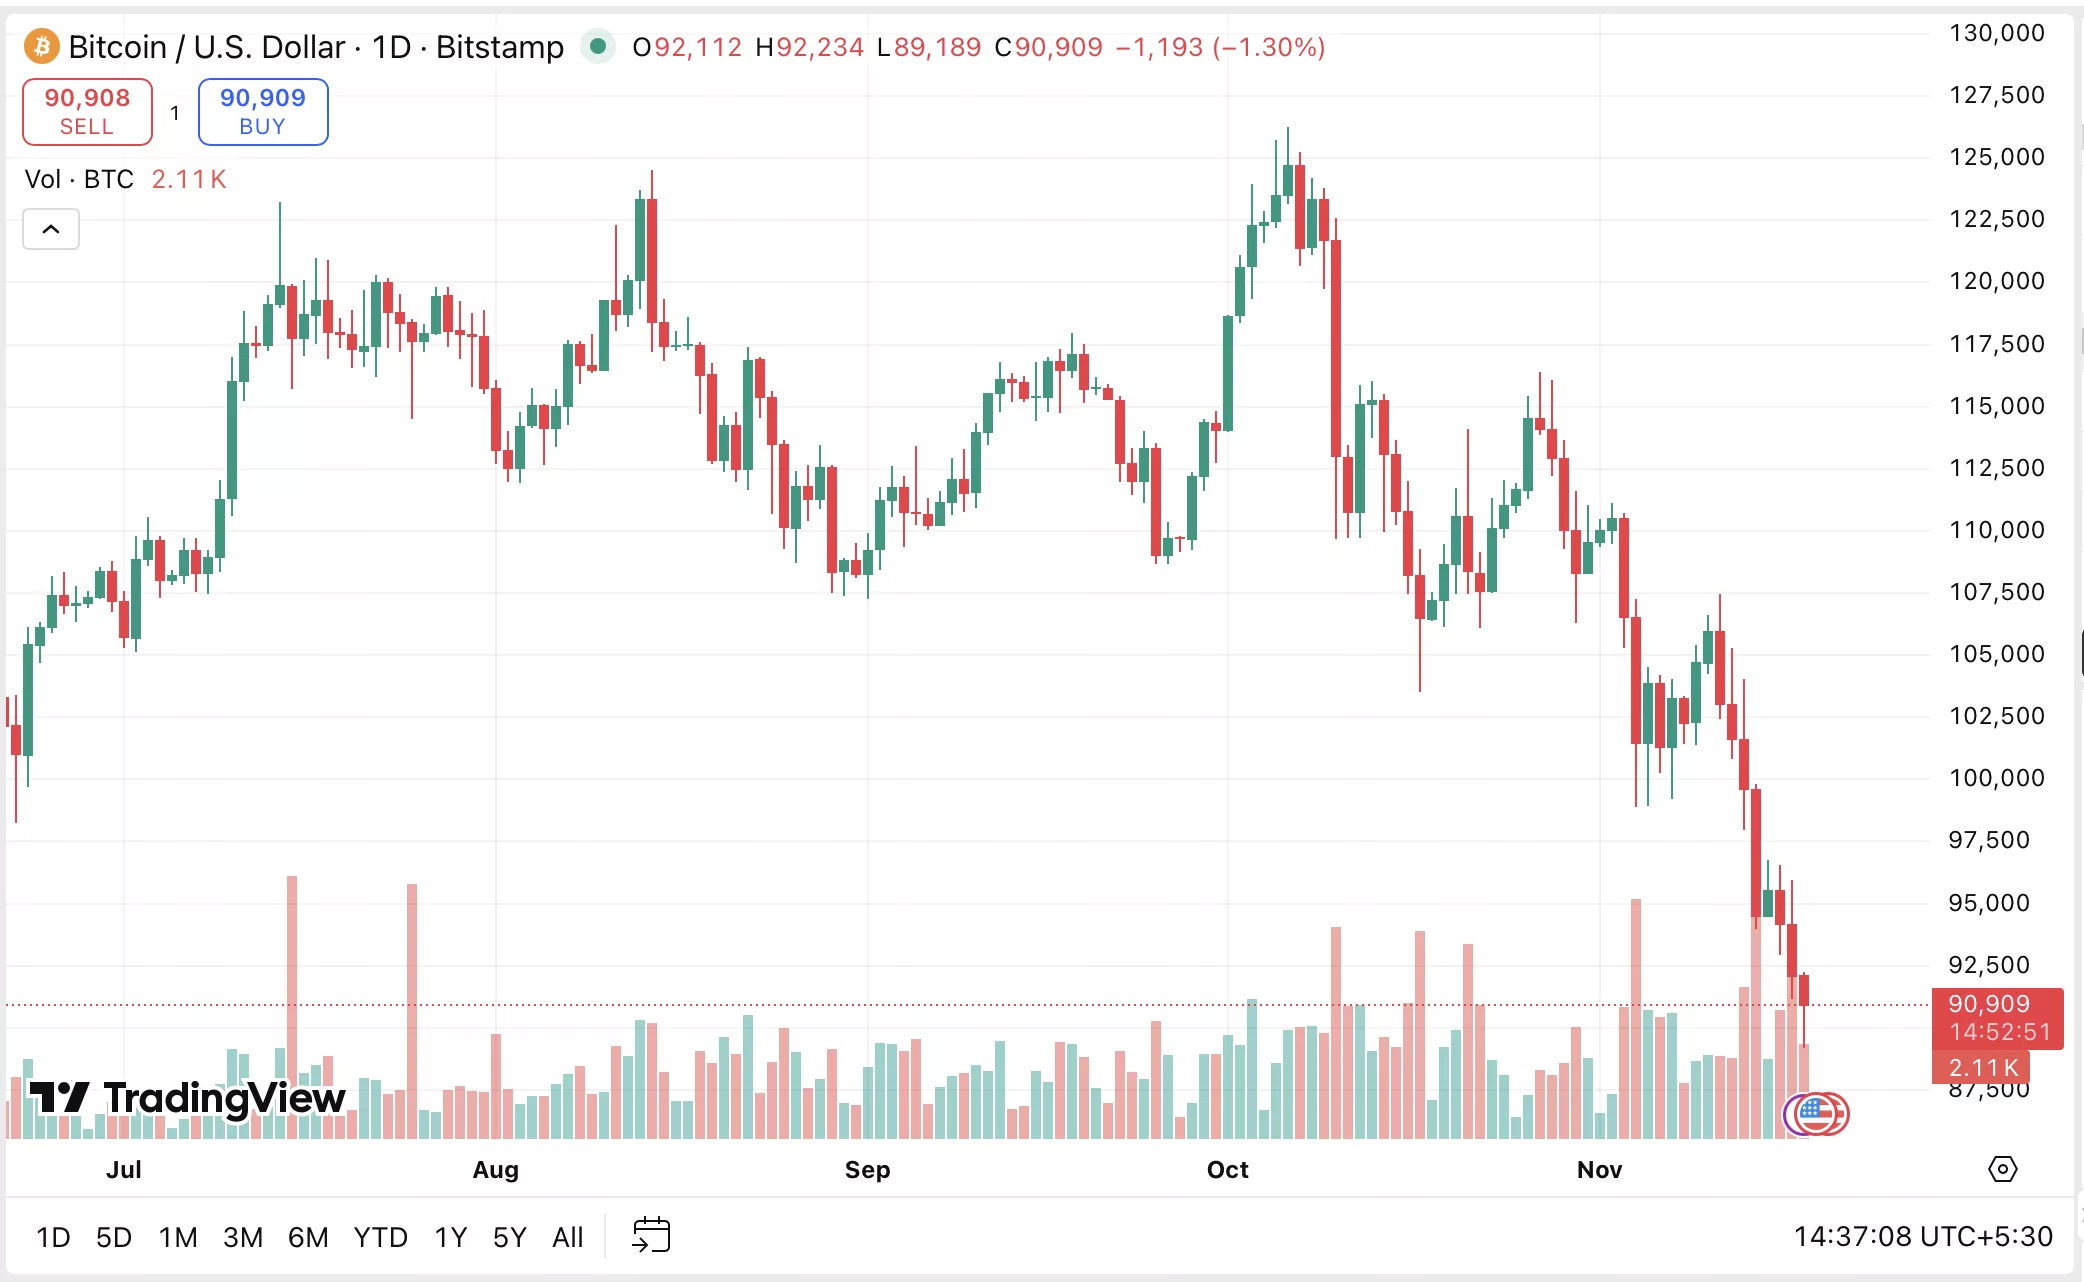
Bitcoin has entered a technical pattern commonly known as a death cross, as its short-term moving average has fallen below its long-term moving average.
The formation appeared after Bitcoin (BTC) dropped under both the 50-day and 200-day moving averages, a setup traders often monitor for potential trend changes. As of this writing, BTC traded around $91,000, down about 5% in the last 24-hours.
Analyst Ali Martinez noted that every death cross over the past year eventually reversed, leading to renewed strength. Martinez also pointed out that in 2022 a similar formation preceded a long downturn, and the current price action mirrors that earlier structure in speed and behaviour.
Bitcoin is also trading under its MVRV mean price, a metric that compares market value with realized value to identify valuation zones. A drop below the mean has historically placed the asset in undervalued territory, based on the model’s readings.
Where is Bitcoin headed next?
Martinez outlined three lower price areas to watch if weakness continues. These zones correspond to past deviation levels and the realized price that marked previous market troughs.
In a separate analysis, Martinez examined earlier Bitcoin cycles. The cycles that peaked in 2017 and 2021 each entered bear markets lasting around 364 days, with drawdowns of 84% and 77%.
If the current cycle top occurred in October 2025, a similar structure would imply a potential bottom in October 2026, based on historical patterns.
On-chain data also shows an increase in Bitcoin transfers to exchanges, which some market watchers interpret as a sign of rising sell-side pressure. Several analysts argue that the technical setup may point toward extended weakness.
Analyst Egrag Crypto offered a counterpoint, arguing that relying too heavily on chart patterns can lead to misreading the market. The analyst said current conditions differ from 2021 and that traditional moving averages have lost reliability.
According to Egrag Crypto, the market remains structurally intact above the 21-week EMA, viewing the recent drop as a retest of long-term support with the potential for a move toward the 1.618 Fibonacci extension.
Source link