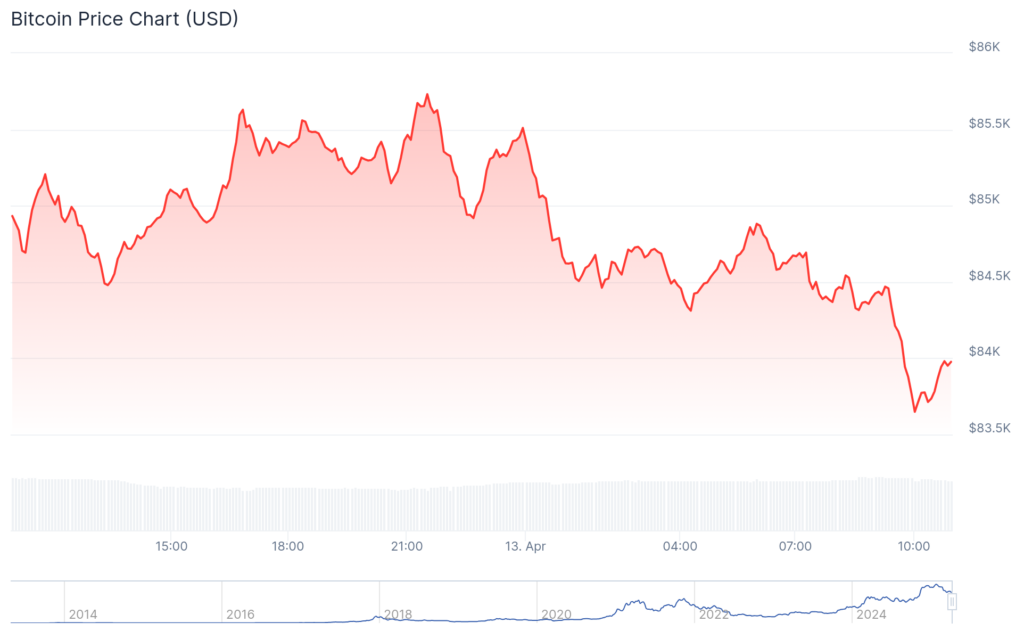
Bitcoin appears ready for a technical breakout from its multi-month downtrend after pumping from its weekly low of $74,773 to below $84,000 at last check on Sunday.

Crypto analyst Rekt Capital tweeted that Bitcoin (BTC) is “mere hours away from performing the initial but crucial steps towards fully confirming a breakout beyond the multi-month downtrend.”
The analyst also highlighted that when Bitcoin successfully breaks a technical downtrend, it establishes a new uptrend phase.
This technical analysis comes as Bitcoin is going through a challenging period. It has dropped 22.3% from its all-time high of $108,786, reached on Jan. 20.
Despite this correction, on-chain data suggests strong accumulation activity at critical price levels.
Over 40,000 Bitcoin accumulated at $79,000
Glassnode data highlights notable Bitcoin accumulation at the $79,000 support level, with approximately 40,000 BTC purchased in this zone. The market has also successfully worked through a larger cluster at $82,080, where roughly 51,000 BTC had accumulated. These levels of accumulation often act as strong support in technical analysis.
According to Glassnode, Bitcoin’s next test will be at $83,500, where another 48,500 BTC is in accumulation. Breaking and holding above this level could accelerate its upward momentum.
One analyst, who goes by the moniker “Merlijn The Trader,” has identified additional bullish signals. He noted that Bitcoin has broken out of a falling wedge pattern with a bullish divergence forming on momentum indicators. This combination often precedes significant price movements, with the analyst setting a potential target of $102,000.
“This is how trends begin,” Merlijn stated.
In technical analysis, the falling wedge pattern is considered a bullish reversal formation characterized by converging downward trend lines.
When price breaks above the upper trend line, it typically signals the exhaustion of selling pressure and a potential shift toward buying momentum.
The current technical setup comes after Bitcoin has experienced substantial volatility in recent months, primarily influenced by broader macroeconomic factors. However, the underlying accumulation patterns suggest institutional and retail investors continue to view price dips as buying opportunities.
On-chain data further supports this view, as long-term holder supply reached historic levels despite the recent price correction. This shows confidence in Bitcoin’s long-term value proposition among investors with historically low time preference.
If Bitcoin confirms the breakout from its multi-month downtrend as analysts suggest, the next major resistances beyond $83,500 would likely appear at the $90,000 psychological level and the $100,000 threshold.

Source link

