


Bitcoin price continued its decline after Trump’s China import threats reignited fears of a renewed U.S.–China trade war.
Summary
- Trump’s cooking oil ban threat on Oct 14 deepened trade war fears.
- Bitcoin dropped below $112K, with $90B trading volume amid volatility.
- Rising liquidations and Fed rate cut uncertainty worsen bearish market sentiment.
Bitcoin traded near $111,925 at press time, easing about 1.3% in the past day as headlines around worsening U.S.–China trade relations rattled risk appetite and traders reduced leverage.
Trading activity has picked up despite the pullback. Bitcoin’s (BTC) 24-hour spot volume rose about 35% to $90 billion, while derivatives turnover climbed nearly 40% to $144 billion, as per CoinGlass data.
At the same time, open interest fell by roughly 2% to $72.5 billion, a sign that traders are closing out leveraged positions rather than opening new ones. This tends to calm volatility in the short term but can leave markets vulnerable to sudden moves.
Geopolitocal tensions put pressure on Bitcoin price
On Oct. 14, U.S. President Donald Trump intensified tensions with China by threatening to ban imports of cooking oil from Beijing in response to China’s ongoing boycott of U.S. soybeans. The statement came after weeks of tariff threats and countermeasures that have deepened fears of a full-blown U.S.–China trade war.
Global markets were unsettled by the move, which caused stocks, commodities, and cryptocurrencies to react sharply. The Nasdaq dropped as much as 3.5%, and investors turned to safer assets like gold and U.S. Treasuries. Bitcoin, often seen as a “risk-on” asset during macro uncertainty, fell alongside equities.
The renewed uncertainty followed last week’s flash crash, where over $19 billion in crypto long positions were liquidated in 24 hours, one of the largest wipeouts in history. Another $600 million in leveraged positions were flushed in the past day as traders unwound risk.
Markets are now watching the upcoming Federal Reserve meeting (Oct. 29–30), with 89% odds of a 25 bps rate cut. However, hawkish hints from recent Fed minutes, highlighting sticky inflation, have tempered optimism. A stronger U.S. dollar and higher Treasury yields are adding pressure on Bitcoin, which tends to underperform during tightening liquidity conditions..
Bitcoin price technical analysis
Bitcoin shows short-term weakness after slipping below key moving averages. The 10-, 20-, and 30-day EMAs sit above price, indicating near-term pressure, while the 200-day averages around $108,000–$107,000 act as long-term support.
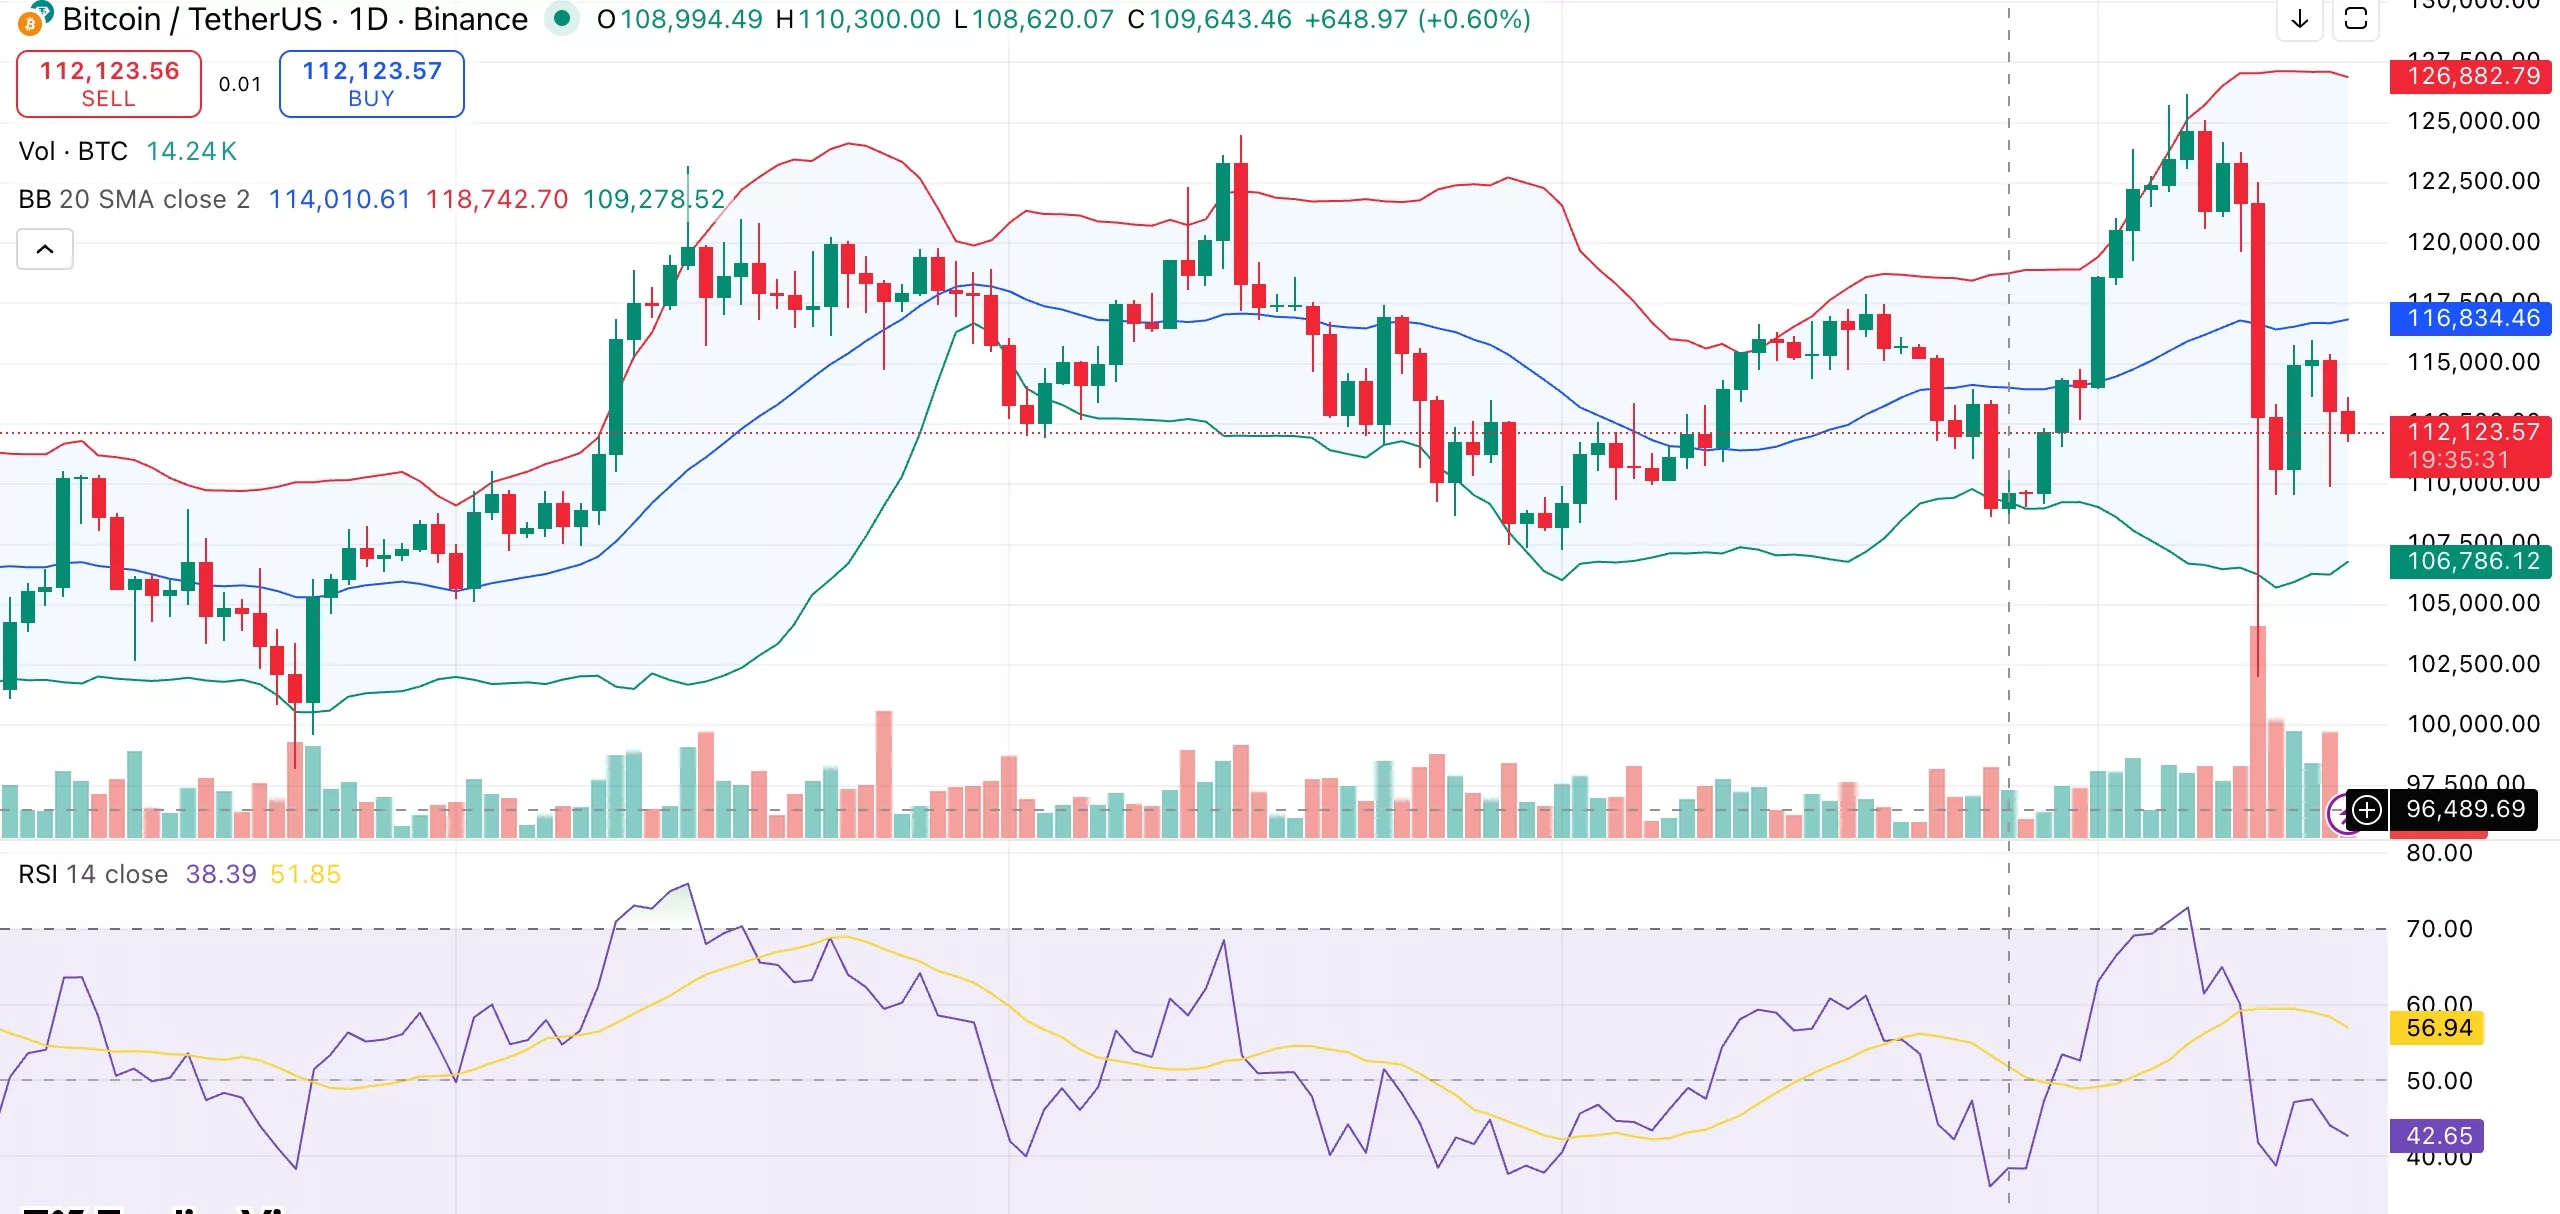
Momentum indicators are bearish. The relative strength index at 43 indicates waning strength but not oversold conditions, and the MACD and momentum are both negative.
Trend signals are moderate, with the average directional index at 25 suggesting a move that could still deepen. Price trades in the lower half of its range, with Bollinger Bands showing cooling but elevated volatility.
Regaining the $115,000–$116,000 resistance could reopen the path to $123,000. Support lies near $108,000–$107,000. Losing it risks a slide to $104,000 or even $100,000. Bulls need stronger volume on rebounds, while bears look for another flush toward the 200-day band.
Source link