Bitcoin’s latest rally has defied past cycle patterns, and one key indicator may explain why investors aren’t selling, even near all-time highs.
Summary
- Bitcoin is holding above $117K despite a recent pullback after all-time high.
- CryptoQuant’s Flow Pulse shows low selling pressure, unlike 2017 and 2021.
- Short-term caution remains, but the long-term trend is still up.
In a July 23 analysis, CryptoQuant contributor Arab Chain highlights a key difference in Bitcoin’s (BTC) behavior this year compared to past peaks. Bitcoin’s flows to exchanges have stayed abnormally low even after hitting an all-time high of $122,838 on July 14.
Large holders may not be getting ready to sell, according to the Bitcoin Flow Pulse indicator, which monitors investor behavior around exchange activity. In contrast, past peaks in 2017 and 2021 were marked by rising inflows and sharp corrections. So far, 2025 is showing consolidation instead, a sign that confidence remains high.
Arab Chain warns that traders should look out for any sudden rise in the Flow Pulse Indicator, as it could act as a warning sign signaling an upcoming sell-off. But for now, the indicator continues to support the uptrend.
Bitcoin may be approaching an overheated bull run
Another CryptoQuant model mentioned by Arab Chain, the Bitcoin Bull and Bear Market Cycle indicator, shows that market is in an overheated bullish phase. This has historically led to short-term spikes followed by corrections.
Long-term trend indicators such as the 30- and 365-day moving averages are still bullish, but Arab Chain advises that new buyers might be better off holding off until there is a more distinct pullback. As of this writing, Bitcoin is up 12% for the month at $117,830, a 4% retracement from its peak.
Bitcoin technical analysis
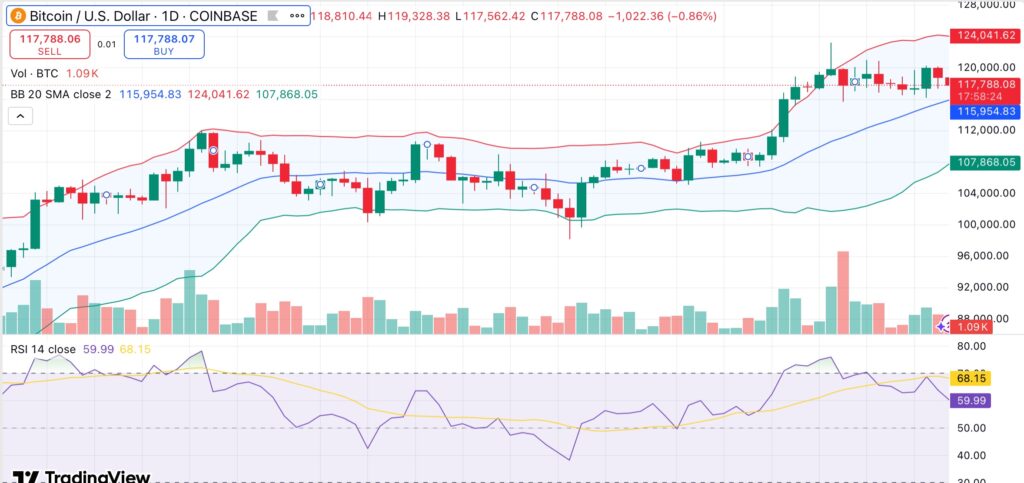
Bollinger Bands show Bitcoin trading in the upper range, with the upper band at $124,041 and the middle band near $115,955, a strong area of support. The relative strength index sits just under 60, suggesting neutral momentum. However, shorter-term moving averages are flashing sell, with the 10-day EMA and SMA both above the current price.

The longer-term indicators are still bullish. The continuous upward trend is supported by the positive stacking of the 50-, 100-, and 200-day moving averages. The MACD and Momentum indicators are short-term bearish, suggesting possible drops but no reversal.
If Bitcoin reclaims $120,000 and pushes through the upper Bollinger Band at $124,041, a retest of the all-time high at $122,838, and even a move to new highs, is possible. Bitcoin may test deeper support levels close to $111,000 if it drops below $115,000.
A break below that would indicate the start of a more significant correction, especially if exchange flows start to increase.

Source link

