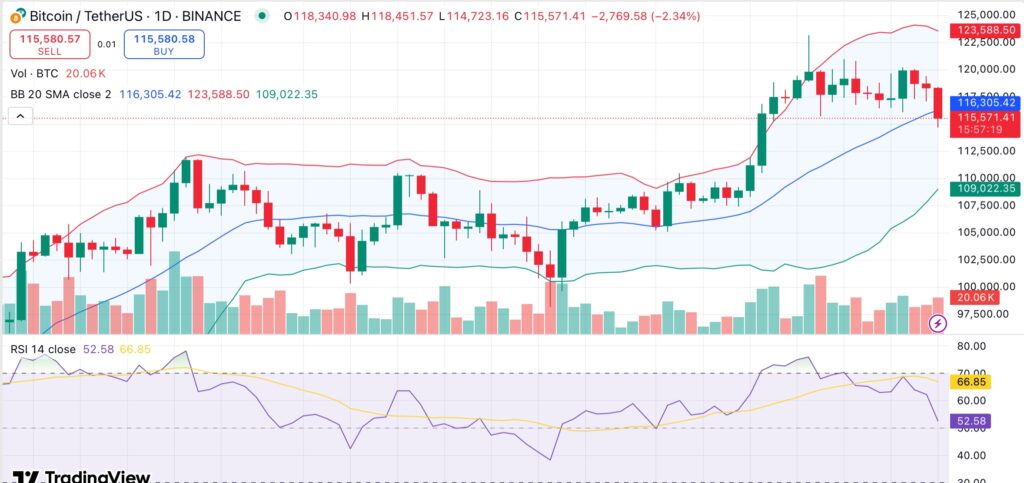
Bitcoin fell to $115,002 on Thursday, slipping over 6% from its July 14 record peak as open interest surged to a new all-time high of $44.5 billion.
Summary
- Bitcoin dropped to $115,002, down 6% from its July 14 all-time high.
- Open interest hit a new record of $44.5B, indicating increased leveraged trading during the decline.
- Binance’s perpetual-spot spread turned positive, signaling long pressure despite price resistance near $120K.
As Bitcoin’s (BTC) price retreats, traders continue to open new positions at record pace. According to an analysis by CryptoQuant contributor Arab Chain, the sharp rise in open interest alongside a falling price indicates that speculators, many using leverage, are increasingly driving the market. This dynamic makes Bitcoin more vulnerable to volatility and liquidations if the trend suddenly shifts.
Instead of long-term investors, such conditions often reflect an influx of short-term players looking to profit from short-term moves. With so much leverage now built in the system, there is a chance that any sudden price reversal could set off a series of liquidations.
Longs build as Bitcoin perpetual prices outpace spot
At the same time, Binance data shows the price of Bitcoin perpetual contracts has risen above the spot market. This positive spread, as noted by CryptoQuant analyst BorisVest, suggests growing long-side pressure as traders bet on upside during intraday moves.
Earlier this week, Bitcoin briefly spiked from $116,000 to $120,000, triggering FOMO among retail traders who rushed to open long positions. However, this $120,000 level acted as resistance. Larger market participants used it to place sell orders, which pushed the price back down.
This pattern indicates that traders are reacting swiftly to price changes and entering positions without waiting for definitive confirmation, even though funding rates are still close to neutral. As a result, the market is more susceptible to immediate responses.
Bitcoin technical indicators point to weakening momentum
On the daily chart, Bitcoin has slipped below the middle line of the 20-day Bollinger Bands, now at $116,305. The price is getting closer to the lower band at about $109,000, which may serve as temporary support. Further selling could be triggered by a clean break below this level.

The relative strength index has fallen from recent highs to 52.58, indicating that the bullish momentum is waning. A deeper retracement toward $109,000 or lower is more likely if Bitcoin is unable to quickly recover the $116,000–$117,000 range.
On the upside, a recovery above $120,000 would indicate that buyers are taking back control and selling pressure is easing.

Source link

