


BNB price has dropped 13% over the past 7 days and is nearing confirmation of a bearish crossover on the chart, which could drive further losses in the coming week.
Summary
- BNB price is down 13% over the past 7 days.
- A bearish double-bottom has been confirmed on the BNB 1-day chart.
According to data from crypto.news, BNB (BNB) price fell to an intraday low of $1,027 on Nov. 3, marking a 6% drop over the past 24 hours and a 13% decline from its highest point last week.
Over the past day, its daily trading volume had almost doubled to $1.8 billion, a factor that, when combined with its price decline, hints at heightened selling pressure and possible panic-driven exits by short-term holders.
BNB’s price drop comes amid a broader downturn across the crypto market today, driven by a wave of short selling and nearly $400 million in liquidations, as traders reposition ahead of the U.S. jobs report due Friday, Nov. 7.
A stronger-than-expected jobs report could dampen hopes for further rate cuts as it would support the Federal Reserve’s current hawkish stance, which has historically added more pressure to risk assets like cryptocurrencies. Conversely, a weaker jobs print may revive rate cut expectations, offering some relief to the market, which includes BNB.
A look at data from Coinglass shows that open interest in the BNB futures market has dropped by nearly half, from $2.97 billion on Oct. 8 to $1.56 billion at press time. This sharp decline, combined with a long/short ratio below 1, suggests that bearish sentiment is firmly in control, with more traders betting on further downside than a recovery in the near term.
This could continue to weigh on BNB’s short-term price action, especially if broader market sentiment continues to remain risk-off and traders hesitate to re-enter long positions.
When writing, the Crypto Fear and Greed Index showed a score of 42, placing the market in the ‘fear’ zone.
On the daily chart, BNB price has formed a double bottom pattern, which traders consider a highly bearish setup if confirmed. The two bottoms had formed near the $1,376 mark, while the neckline is situated around $1,074.
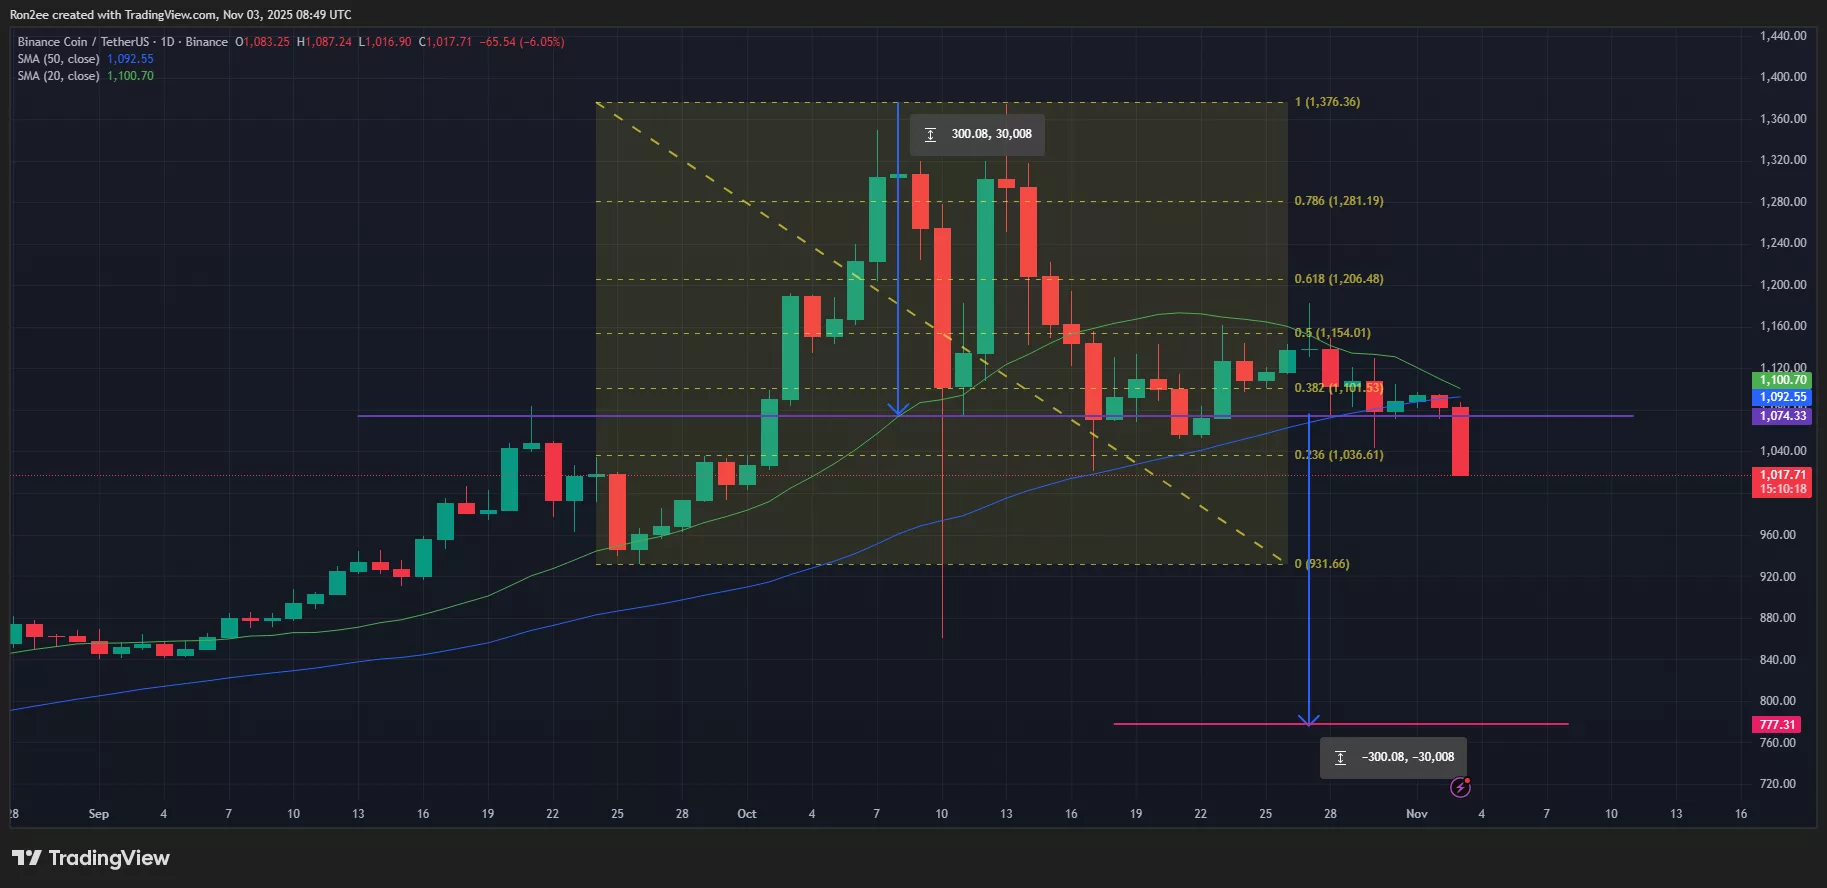
The altcoin’s price action has now slipped below the neckline, confirming a potential breakdown that could trigger further downside momentum.
Technical indicators also appear to support a bearish case, at least in the short term. The 20-day simple moving average looks on track to cross below the 50-day SMA. This kind of bearish crossover is often seen as an early warning sign of extended weakness.
The Supertrend indicator, which is used to gauge trend direction and strength, has also flipped red after crossing above the price line, a telltale signal that momentum has turned decisively bearish.
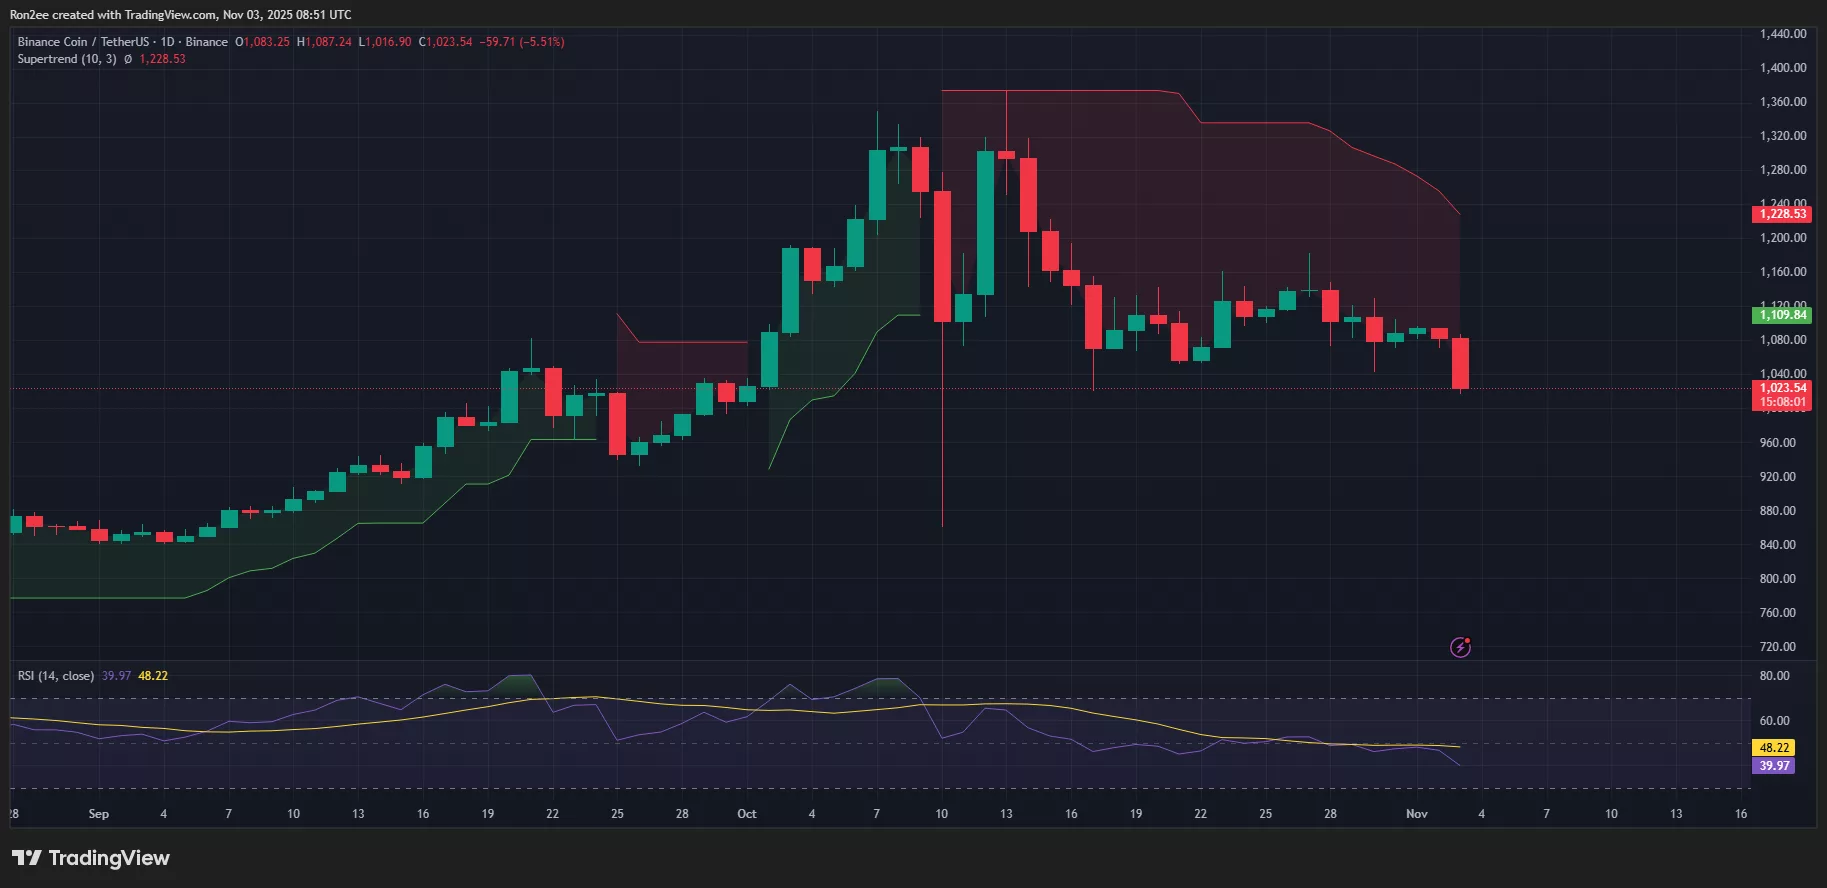
The RSI line has moved below the neutral threshold of 50, a sign that sellers are outweighing demand from buyers.
For now, the next key support for BNB sits near $931.6. This level was previously held during the token’s drop in September and could act as a potential floor again.
If that support fails to hold, bears may target a deeper pullback toward $777.3. This level is derived by measuring the height of the double bottom formation and projecting it downward from the neckline. At the time of writing, this downside target lies nearly 24% below the current market price.
A decisive rebound above $1,100, which aligns with the 50-day SMA, would invalidate the bearish setup and could open the door for a short-term recovery.
At press time, BNB was exchanging hands at $1,031 per coin.
Disclosure: This article does not represent investment advice. The content and materials featured on this page are for educational purposes only.
Source link