


BNB price is under pressure as a wave of uncertainty sweeps through the crypto market, pulling major tokens toward their monthly lows.
Summary
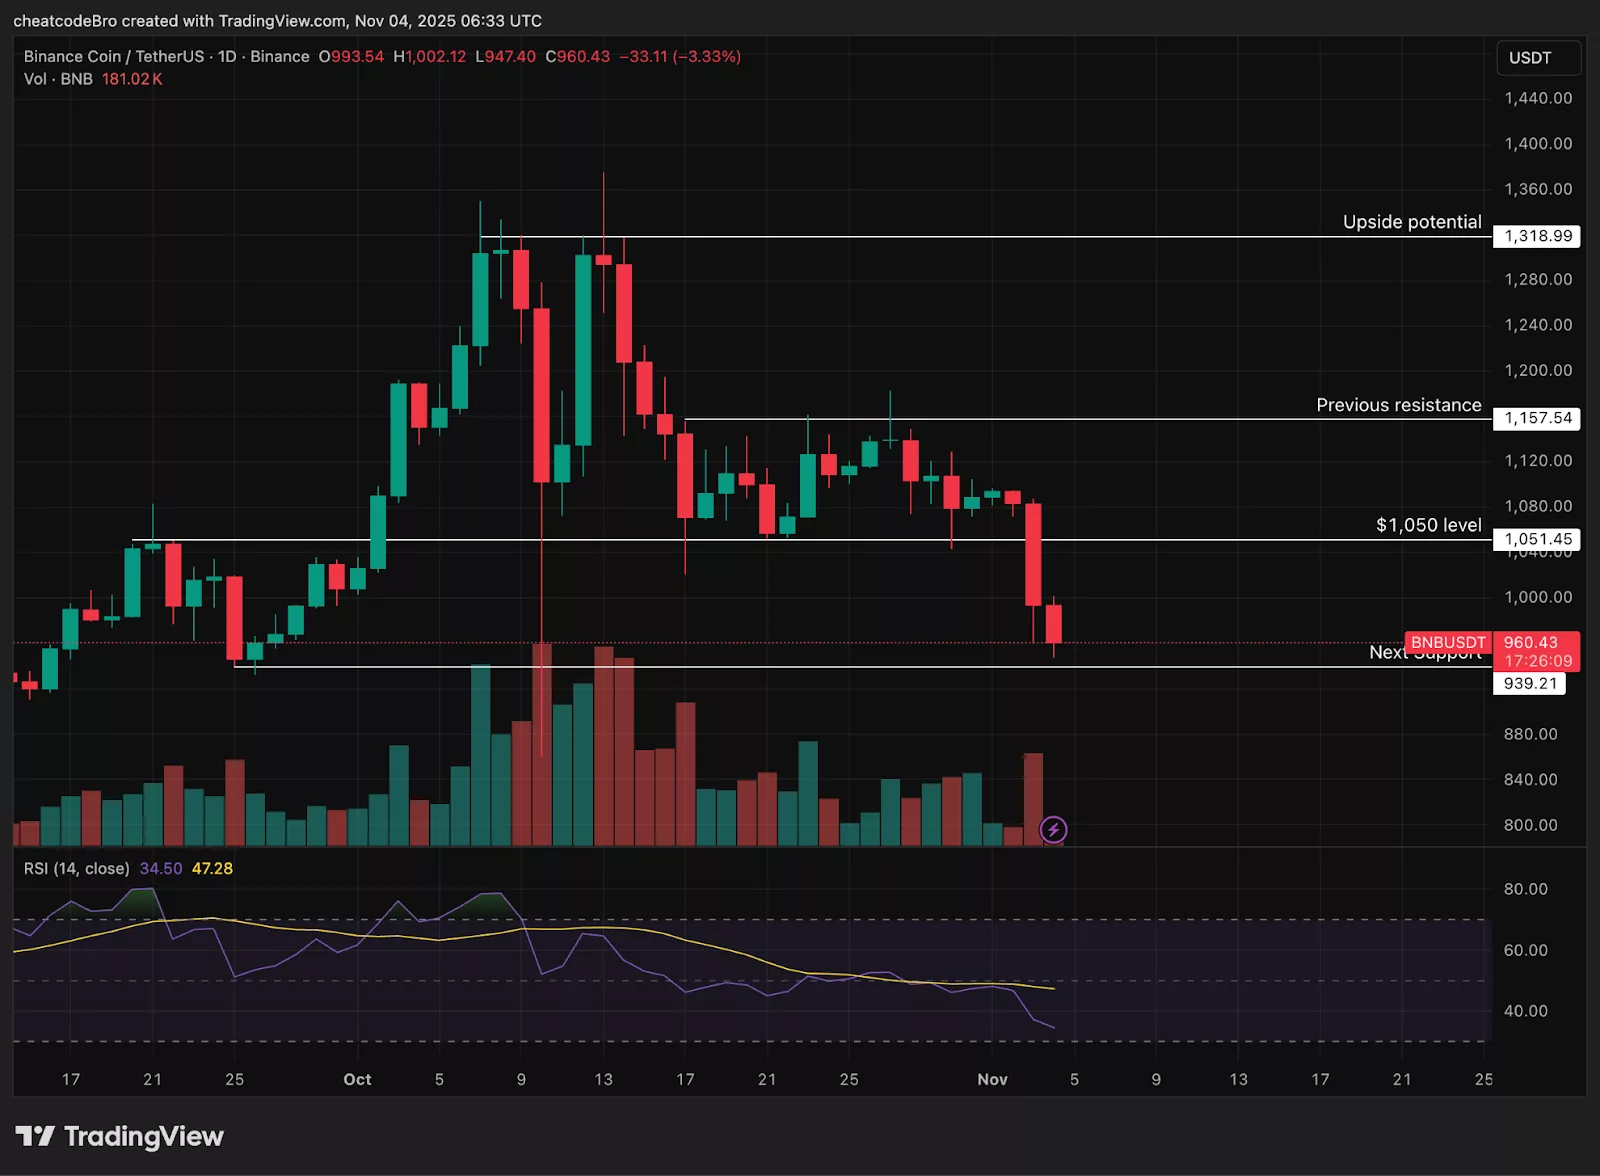
- BNB has fallen below the crucial $1,000 mark, dropping 8.6% in 24 hours and 12.5% over the week as overall market sentiment weakens.
- The token has slipped under its 25-day and 50-day moving averages, leaving the 100-day moving average near $940 as the next key support level.
- While a rebound could occur if buyers defend current levels, continued market pressure may push its price below $900 in the coming days.
BNB is hovering near $950 today, marking a decline of 8.6% over the past 24 hours and a steep 12.5% drop on the week, per market data from crypto.news. The BSC native token briefly touched $947 as its daily low, while the high for the session reached $1,002, underscoring volatile conditions.
The slide in BNB (BNB) below the $1,000 mark follows a stretch of sideways movement seen since mid-October. The token had maintained support above $1,050, despite multiple attempts by sellers to push it lower. This level had acted as a key floor throughout the past weeks, but increased selling pressure has eventually broken through it.
The recent breakdown coincides with widespread weakness across the sector, with Bitcoin (BTC) slipping under $105,000 and Ethereum (ETH) to $3,500. Other major altcoins are not spared, Solana (SOL) is now trading around $158 and XRP (XRP) under $2.30, with all of these are approaching the lows seen during the steep market correction on October 10.
BNB now faces a critical test to reclaim the $1,000 threshold. Given its ability to hold steady above major support through previous waves of selling, it may respond with the same strength seen earlier in the cycle.
BNB price seeks support at $940
Despite the recent downturn, BNB continues to show relative strength compared to its peers. Since July, the token consistently used its 25-day moving average as support, with all major moving averages stacked in bullish order, signaling a strong underlying trend.
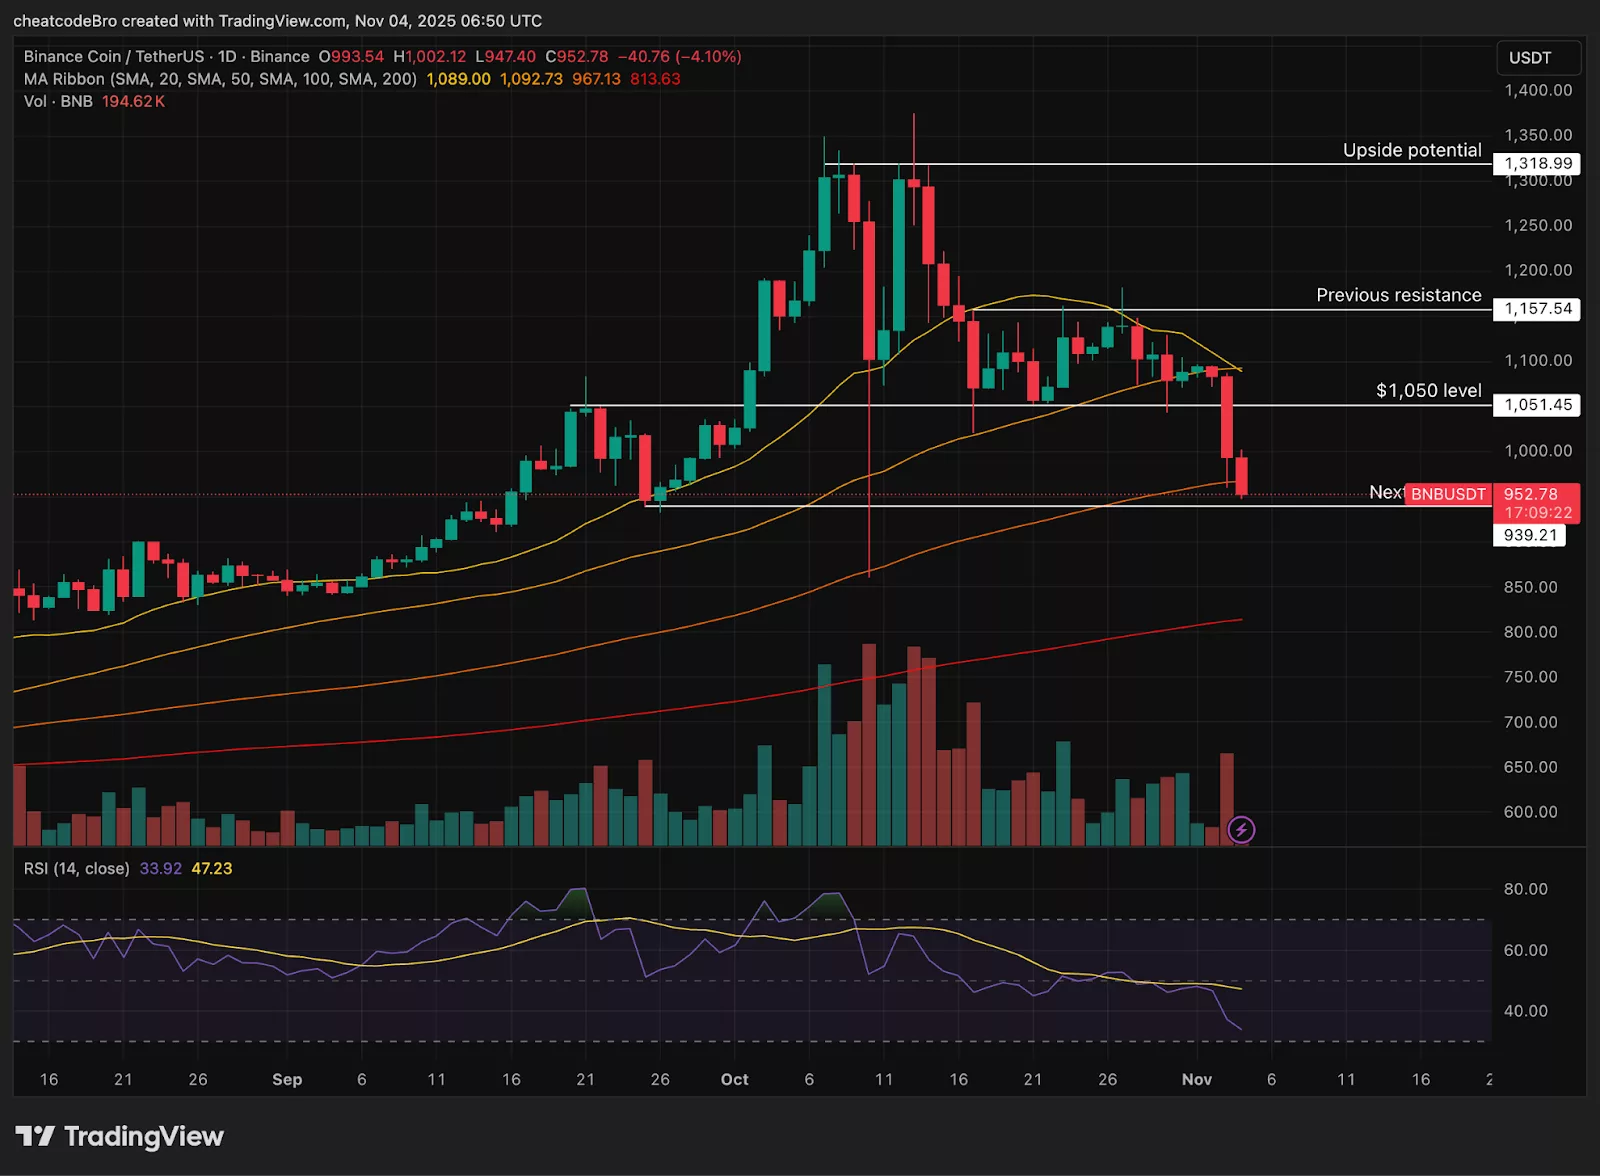
In mid-October, the Binance coin lost its 25-day average as support but found stability at its 50-day moving average. This shift reflected some loss of momentum, yet the coin still maintained a stronger technical structure than much of the market.
With the latest downturn, BNB price has now dipped below both the 25-day and 50-day averages, putting the focus on the 100-day moving average as the next key support near $940. If buyers step in at this level, a rebound could materialize, but the support may not hold if the overall market remains under pressure.
Should sentiment stay negative and the selling continue, the token risks sliding below $900 in the near term.
Source link