


A minor crypto rally is underway as investors predict that the Federal Reserve will slash interest rates after the weak jobs data and encouraging producer inflation data.
Summary
- The crypto rally could be derailed as Bitcoin has formed risky chart patterns.
- It has formed a bearish flag pattern on the daily timeframe chart.
- BTC also formed a large rising wedge pattern on the weekly chart
Bitcoin (BTC) price neared the resistance point at $114,000, while the market capitalization of all coins jumped to $3.95 trillion. The top gainers were coins like Pump, Mantle, and Wormhole.
Crypto rally fueled by Fed cut hopes and altcoin ETF approvals
The ongoing crypto market rally is happening as investors anticipate that the Federal Reserve will cut interest rates, potentially by 0.50% at its coming meeting.
Odds of Fed cuts rose after the US published a weak jobs report last Friday. This report showed that the economy created just 22,000 in August as the unemployment rate rose to 4.3%.
The US also published an encouraging producer inflation report. According to the Bureau of Labor Statistics, the headline and core PPI dropped unexpectedly in August. This report raised the probability that the upcoming CPI data will be lower than expected.
A Federal Reserve cut would, in theory, be bullish for the crypto market as it would boost liquidity, reduce bond yields, and lower the value of the U.S. dollar.
The other potential catalyst for the crypto rally is that the Securities and Exchange Commission will approve multiple altcoin ETFs in October, such as Dogecoin, XRP, and Cardano. These approvals will be bullish for these coins because they will lead to more inflows from American investors.
Bitcoin price bearish flag and wedge patterns point to a retreat
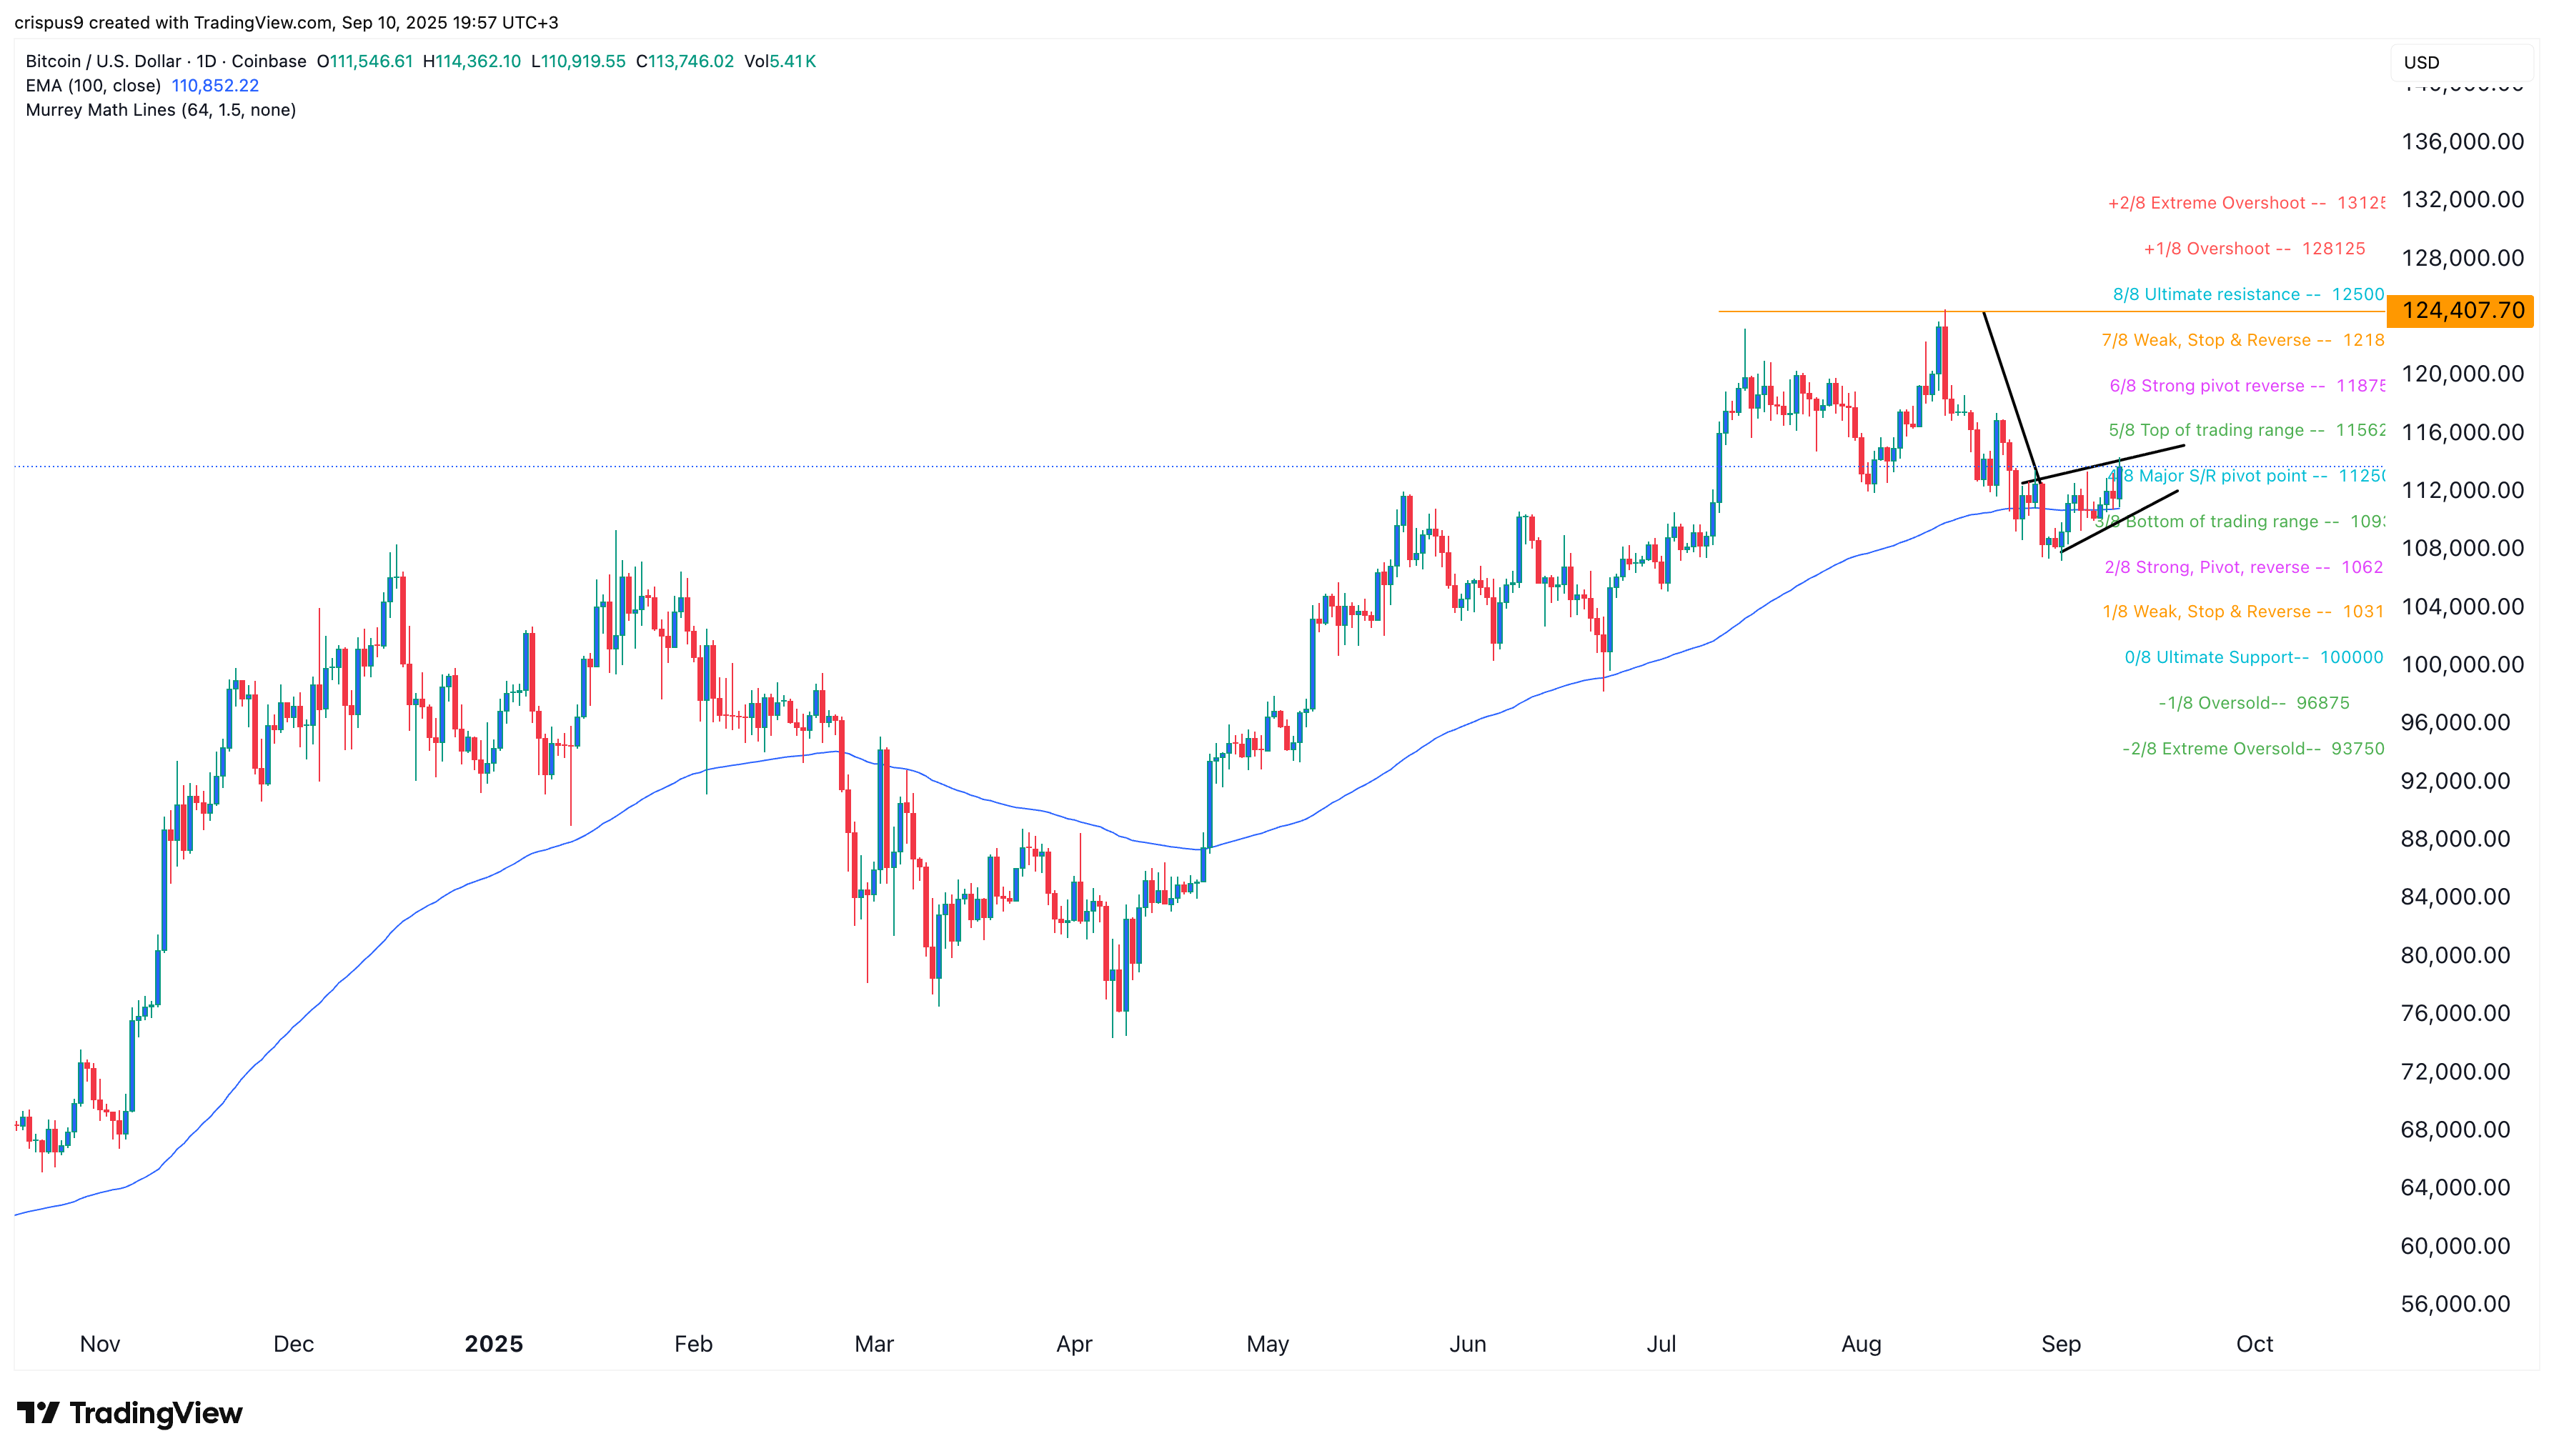
The daily time frame chart shows that the BTC price remains in a tight range. It has remained below the important resistance level at $115,000.
Bitcoin has formed a rising wedge pattern, which comprises two ascending and converging trendlines. This wedge formed after the coin dropped from the all-time high of $124,200. As such, it is part of the formation of a bearish flag pattern, which often leads to more downside.
Bitcoin has also hit the major S/R pivot point of the Murrey Math Lines. Therefore, it may retreat in the coming days, potentially to the ultimate support at $100,000.
BTC price formed a giant wedge on the weekly chart
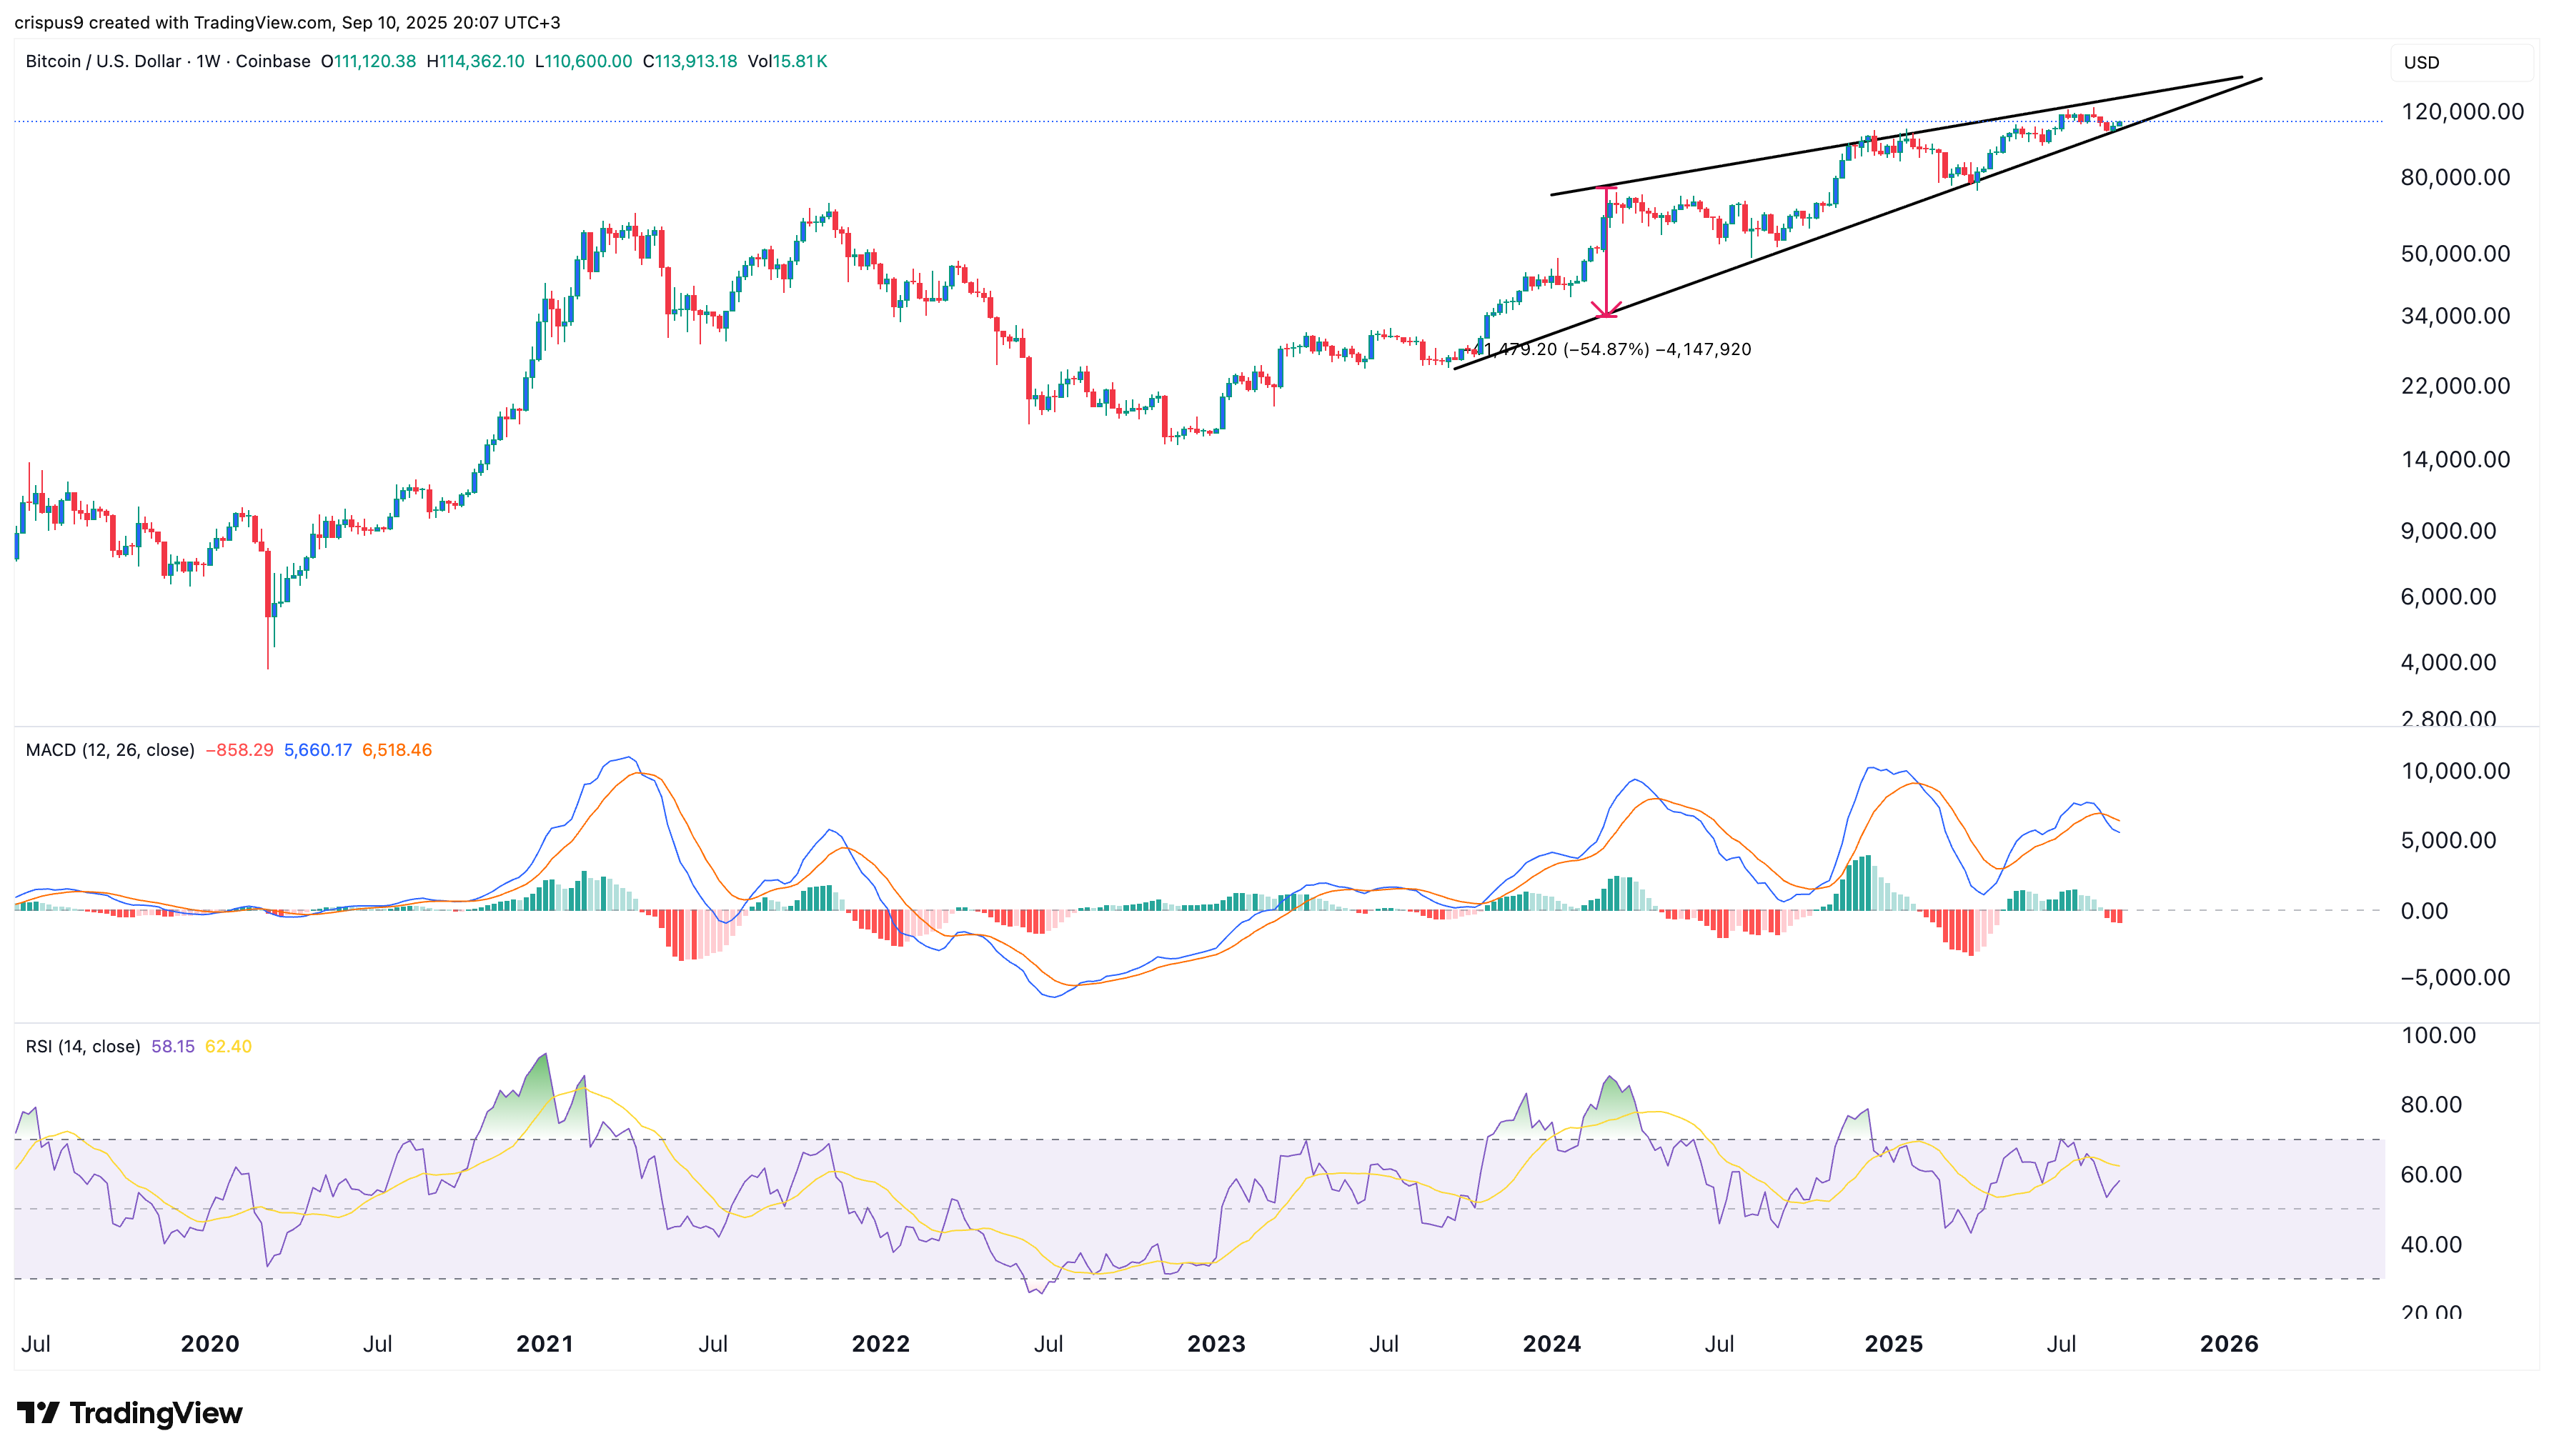
The most bearish forecast for Bitcoin price is on the weekly chart, which shows that the coin has been forming a giant wedge since March last year and that the two lines are nearing their convergence.
The Relative Strength Index and the MACD indicators have formed a bearish divergence pattern, which is often followed by a big drop.
Therefore, if this forecast is correct, it means that the crypto rally could be derailed, as Bitcoin is usually the main catalyst for the broader industry.
Source link