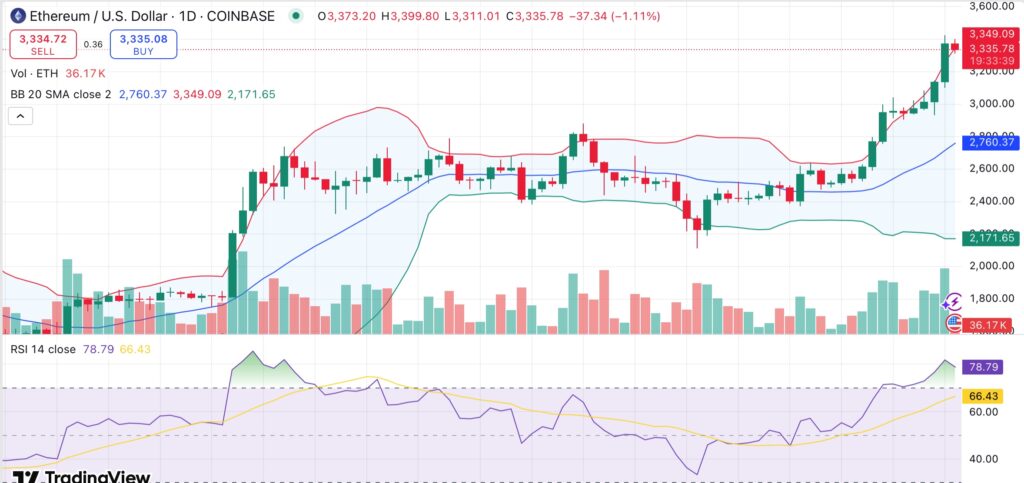
Ethereum surged past the $3,300 mark on July 16, trading at levels not seen since early February, as inflows into spot Ethereum exchange-traded funds hit a new all-time high.
As of this writing, Ethereum (ETH) is up 7% over the last day, trading at $3,336. The token peaked at $3,385 intraday, marking a significant breakout after weeks of range-bound movement. ETH has gained 20% in the last week and has now increased by about 30% in the last 30 days. It is only 31% below its peak of $4,878, which was reached in November 2021.
The rally comes as demand for U.S. spot ETH ETFs is at an all-time high. According to SoSoValue data, U.S.-listed ETH ETFs saw net inflows of $717 million on July 16, the highest daily total to date. These funds now hold over 4% of Ethereum’s circulating supply.
BlackRock’s ETHA led the inflows with a $489 million net addition, its single-largest daily tally, while Fidelity’s FETH followed with $113 million. The new high easily surpassed the previous record of $428 million set on Dec. 5, 2024, as per Farside Investors data. Monthly inflows have now crossed $2.27 billion, further demonstrating renewed institutional interest.
Along with ETFs, corporate treasuries have contributed to the recent upswing. Several companies have disclosed sizable ETH positions in recent months. Bit Digital, GameSquare, and SharpLink Gaming are among the companies that are expanding their Ethereum reserves as part of their long-term balance sheet strategies.
Large financial institutions like Goldman Sachs and Standard Chartered have also started reallocating some of their Bitcoin (BTC) holdings into Ethereum. 53 publicly traded companies currently own approximately 1.6 million Ethereum, valued at an estimated $5.3 billion, according to data from Strategic ETH Reserve.
From a technical standpoint, Ethereum’s recent price action indicates both strong upward momentum and exhaustion. The rally has propelled ETH well above its short- and medium-term moving averages. Ethereum’s price has closed above the upper bound of the Bollinger Bands, a signal that often precedes a cooling-off period.

At around 79, the relative strength index indicates that the market is overbought. Additionally, other indicators, like the Commodity Channel Index, are flashing red, indicating that short-term traders might begin to take profits.
Still, the broader structure remains constructive. Strong bullish trends are confirmed by moving averages that are still trending upward over the majority of timeframes. Although momentum might slow, institutional flows and corporate buying provide underlying support, which suggests any correction may be temporary.
ETH may attempt to test the $3,500 mark next if inflows hold or pick up speed. On the other hand, as overbought signals intensify, failure to maintain above the $3,300 zone may result in another round of consolidation.

Source link

