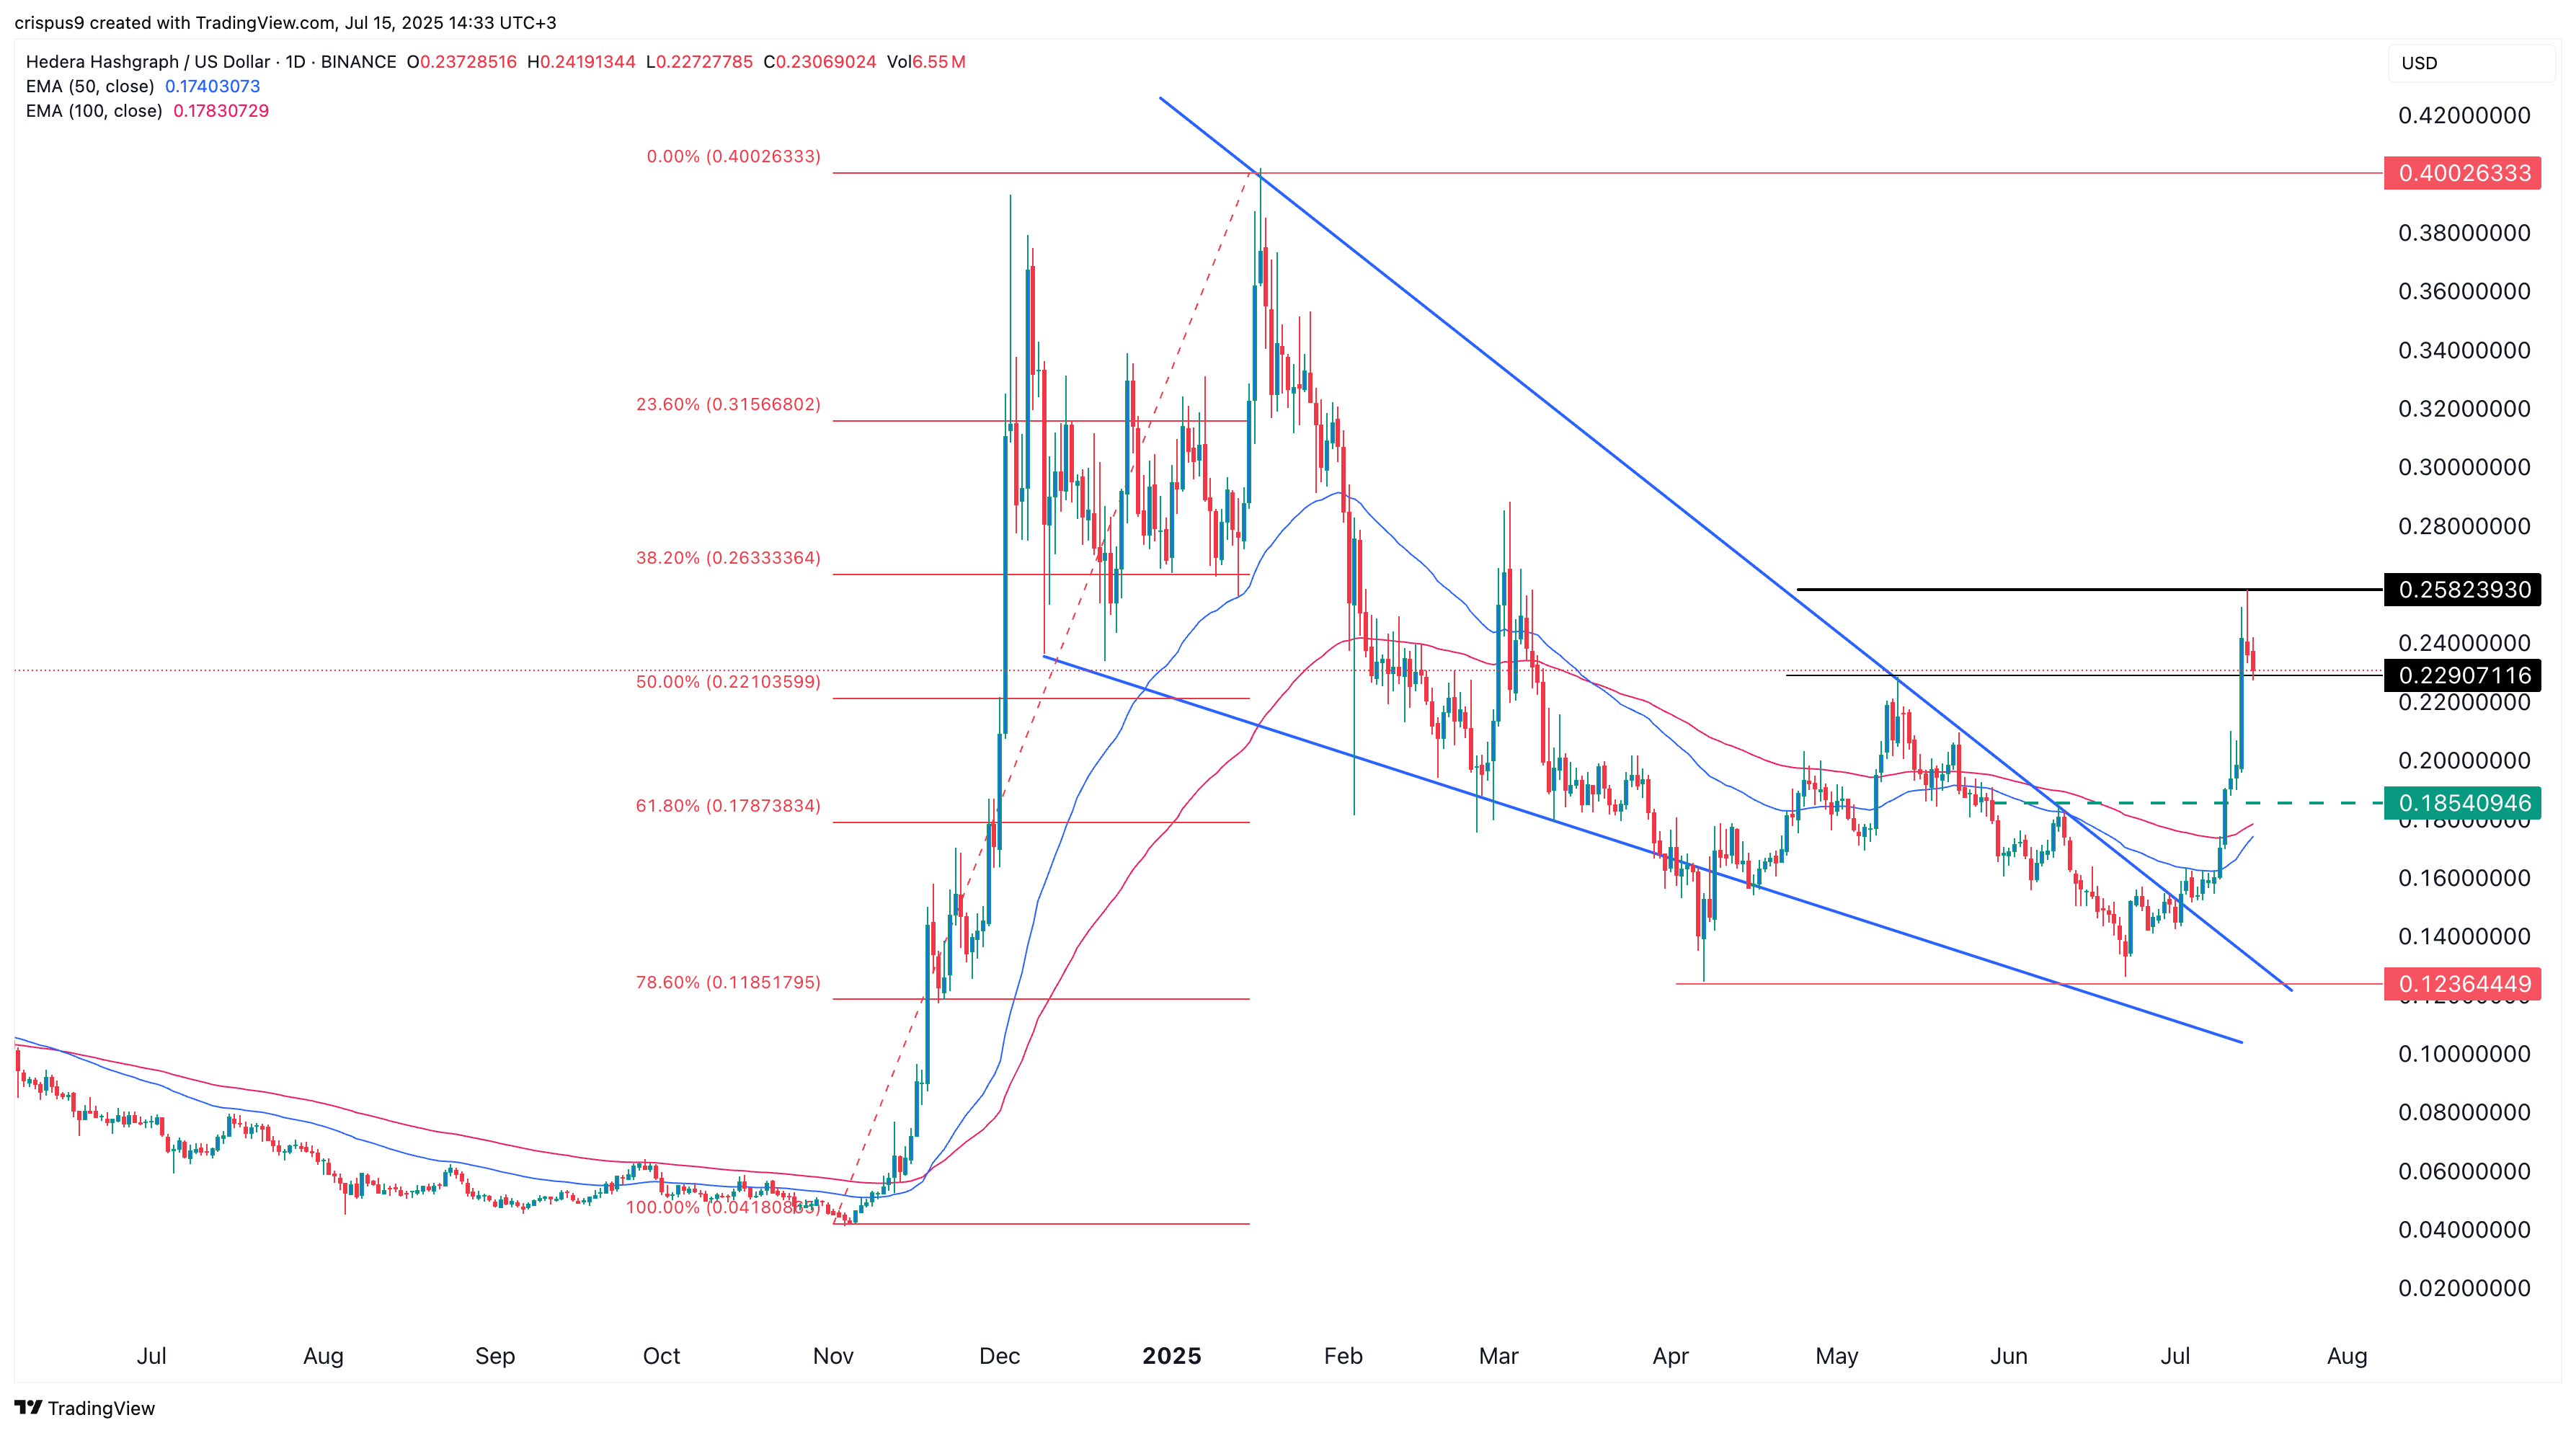
Hedera Hashgraph token price pulled back on Tuesday, July 15, as the recent bullish momentum faded.
Hedera Hashgraph (HBAR)retreated to a low of $0.2290, down 12% from its highest point this month. Its retreat coincided with that of Bitcoin (BTC) and other altcoins.
HBAR has been one of the best-performing cryptocurrencies during the recent bull run, surging over 100% from its monthly low. This surge was supported by a sharp increase in stablecoin supply within its ecosystem.
DeFi Llama data shows that stablecoin supply has jumped by more than 292% in the past 30 days to over $160 million and is nearing the year-to-date high of $212 million.
Rising stablecoin supply is typically a sign of strength for a blockchain network, as these assets are often used to facilitate transactions across decentralized applications.
Additional data shows that the total value locked in Hedera Hashgraph’s ecosystem has increased significantly over the past few weeks. It has climbed by more than 55% in the last 30 days, with protocols like Stader, SaucerSwap, and Bonzo Finance leading the way.
Decentralized exchange activity has also picked up. SaucerSwap and HbarSuite recorded higher trading volumes recently, with monthly volume in July exceeding $123 million, just below last month’s $131 million.
Meanwhile, there are growing expectations that the Securities and Exchange Commission may approve a spot HBAR ETF, a development that could attract additional institutional inflows from Wall Street.
HBAR price technical analysis

The daily chart above helps explain why Hedera’s price staged a strong comeback. The token formed a highly bullish falling wedge pattern, characterized by two descending and converging trendlines. The breakout occurred as the trendlines neared their point of confluence.
HBAR also formed a double-bottom pattern at $0.1236 with a neckline at $0.2290. A double bottom is considered a classic bullish reversal signal in technical analysis.
However, the risk is that HBAR’s price has deviated significantly from its 50-day and 100-day moving averages. It currently trades about 30% above these averages, indicating a potential mean reversion.
Mean reversion refers to the tendency of an asset to return to its historical averages. If this plays out, HBAR may decline from its current level of $0.2320 toward the 50-day moving average at $0.1740 before potentially resuming its upward trend.

Source link

