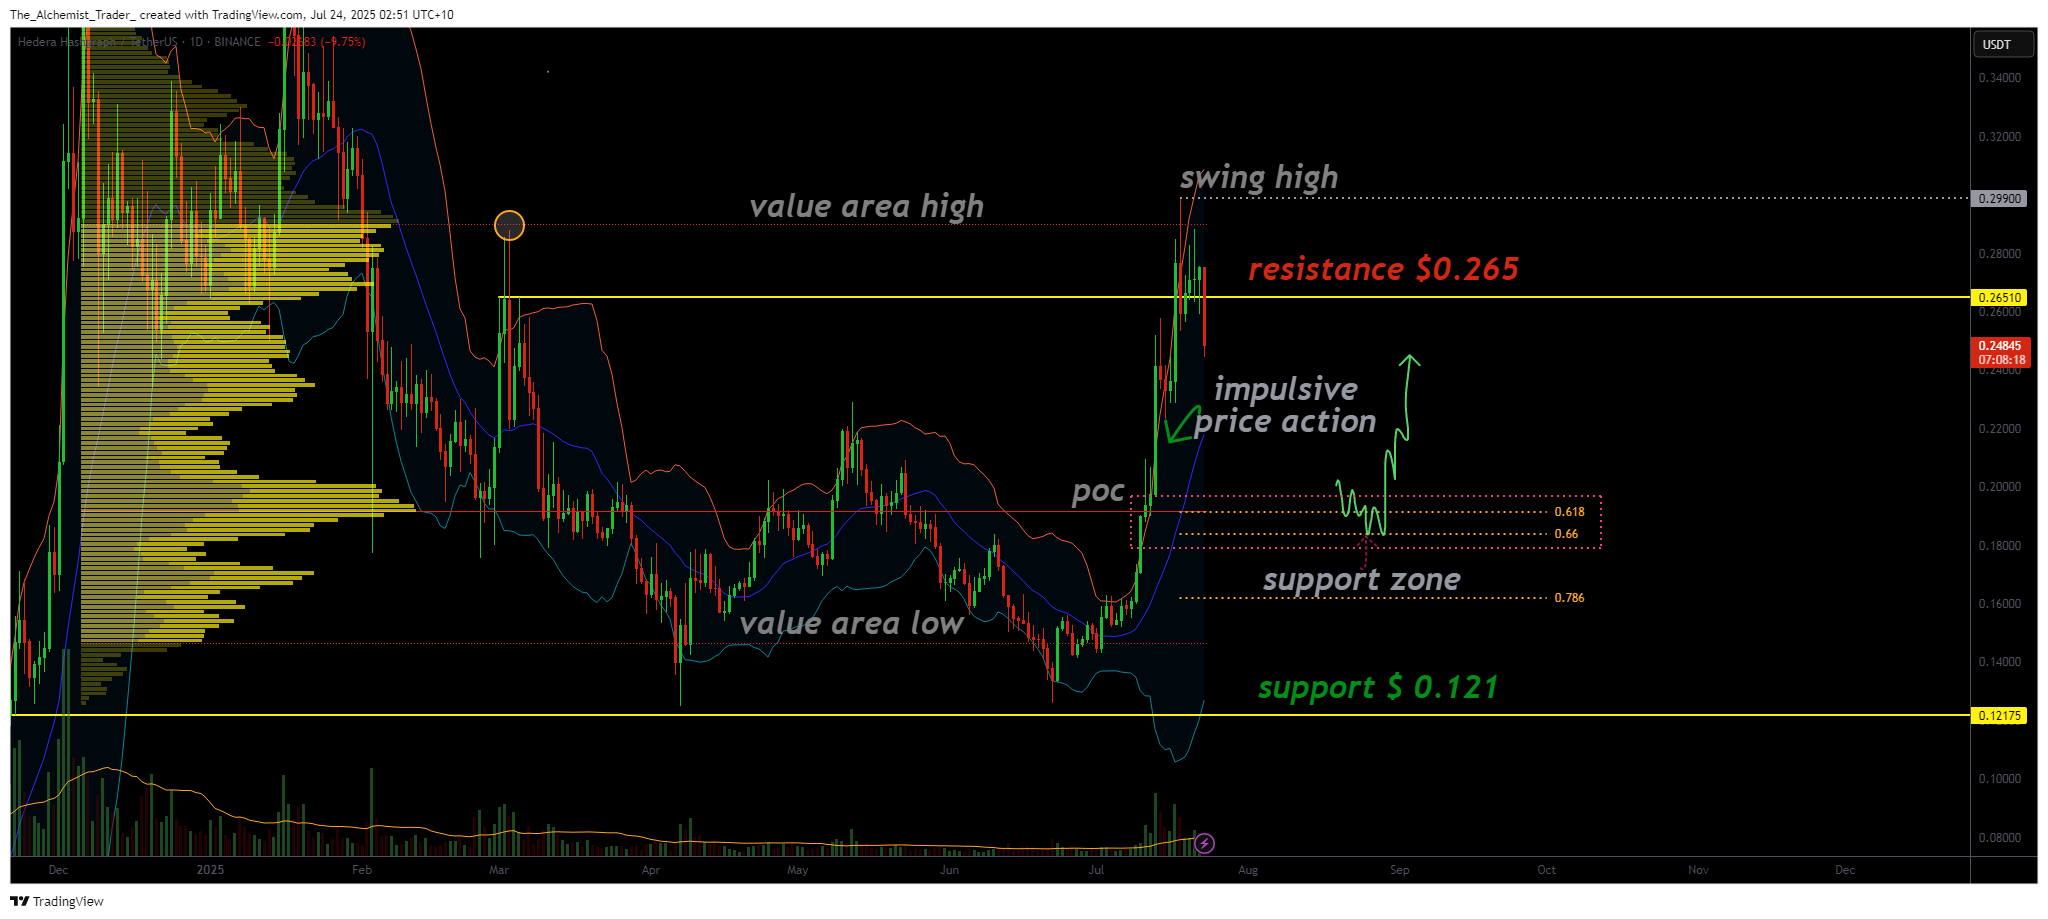
Hedera Hashgraph is showing early signs of weakness after rejecting from key resistance and losing structural support. A deeper correction to $0.18 could provide the foundation for a bullish reversal.
Summary
- HBAR was rejected from the value area high and lost $0.26 key support.
- Price could correct to $0.18 — a confluence of point of control and 0.618 Fibonacci.
- Failure to reclaim resistance keeps HBAR rangebound between $0.12 and $0.26.
Hedera Hashgraph (HBAR) has lost momentum following a rejection from the value area high and is now trading below a critical level at $0.26, a key former support that has flipped into resistance. This development suggests the potential for a continued pullback, particularly as the recent bullish rally lacked structural support zones, leaving a price vacuum beneath current levels.
The rejection from the value area high has confirmed a new swing high and introduced bearish pressure into the structure. Since price failed to establish any meaningful support during its prior impulsive move up, HBAR is now vulnerable to correcting all the way down toward the point of control, currently situated around the $0.18 level.
Key technical points:
- Rejection from Value Area High: Price was rejected from $0.26, flipping former support into resistance
- Lack of Built-Up Support: Impulsive rally left a price vacuum down to the $0.18 level
- Point of Control + Fibonacci Support: Strong confluence around $0.18 could act as base for reversal

From a structural perspective, the price action suggests that HBAR is transitioning into a broader range, with support at $0.12 and resistance at $0.26. The invalidation of $0.26 as support confirms the range-bound nature of the current market. If price continues to close daily candles below this resistance, the likelihood of further downside increases.
The $0.18 level, where the point of control and 0.618 Fibonacci overlap, presents the first major area where bulls could regain control. If HBAR corrects to this zone and manages to build a base, it could form a higher low and resume the broader uptrend. However, failure to hold $0.18 opens the door to further downside, likely dragging price back toward the range support at $0.12.
While short-term momentum favors bears, long-term structure remains salvageable if the upcoming correction results in a healthy reset rather than a breakdown. Traders should closely monitor how price reacts to the $0.18 region over the coming days and weeks.
What to expect in the coming price action:
HBAR is likely to continue correcting toward $0.18, where strong support exists. A bounce here could re-establish a bullish structure, while a failure to hold opens the way for further downside toward the $0.12 range support.

Source link

