


Aave is showing signs of stability near the $265 level after a sharp retracement, even as it becomes the first decentralized finance protocol to surpass $60 billion in net deposits.
Summary
- Aave price consolidates at $265, up 3% daily, but down 6% in 30 days.
- Net deposits top $60B, while TVL and fees signal growing DeFi demand.
- Technical indicators remain neutral, with upside potential above $280.
At $265, Aave (AAVE) is up 3% over the last day but down 4.8% for the week and 6% for the last 30 days. This price movement coincides with a significant on-chain milestone. The lending protocol is now the first DeFi project to reach a net deposit of over $60 billion, according to their Aug. 6 post on X.
Net deposits refer to the difference between total supplied assets and borrowed assets on Aave. A positive figure indicates that more money is being lent than taken out or borrowed, which reflects capital inflows and user confidence. Stani Kulechov, the founder of Aave, framed the milestone as evidence of growing interest in DeFi.
Aave on-chain metrics surge but market activity cools
This trend is supported by DeFiLlama data. Aave’s TVL increased by more than 45%, from $24 billion in early July to $34.9 billion. With network fees rising from $48 million in June to $65 million in July, protocol revenue also rose, highlighting deeper usage and borrower activity.
To boost developer adoption, Aave released its V3 developer toolkit on Aug. 6. The toolkit includes React hooks, SDKs, and APIs to facilitate the deployment of lending vaults. These vaults enable protocols to provide lending strategies with customized risk settings, facilitating modular borrowing or yield generation.
Market activity remains cautious despite the strong on-chain metrics. Aave’s 24-hour spot volume fell 13% to $297 million, while derivatives volume dropped 19.3% to $503.6 million, per Coinglass data. Still, open interest rose 4.1% to $561.9 million, suggesting that leverage is quietly building despite the muted volume, often a sign of positioning ahead of a move.
Aave technical analysis
Aave appears to be consolidating close to important support levels. The MACD is in bearish territory at -9.31, while the relative strength index is neutral at 43.3. The 100- and 200-day SMAs are still in buy zones, but the majority of short- and mid-term moving averages, such as the 20-, 30-, and 50-day EMAs, are displaying sell signals.
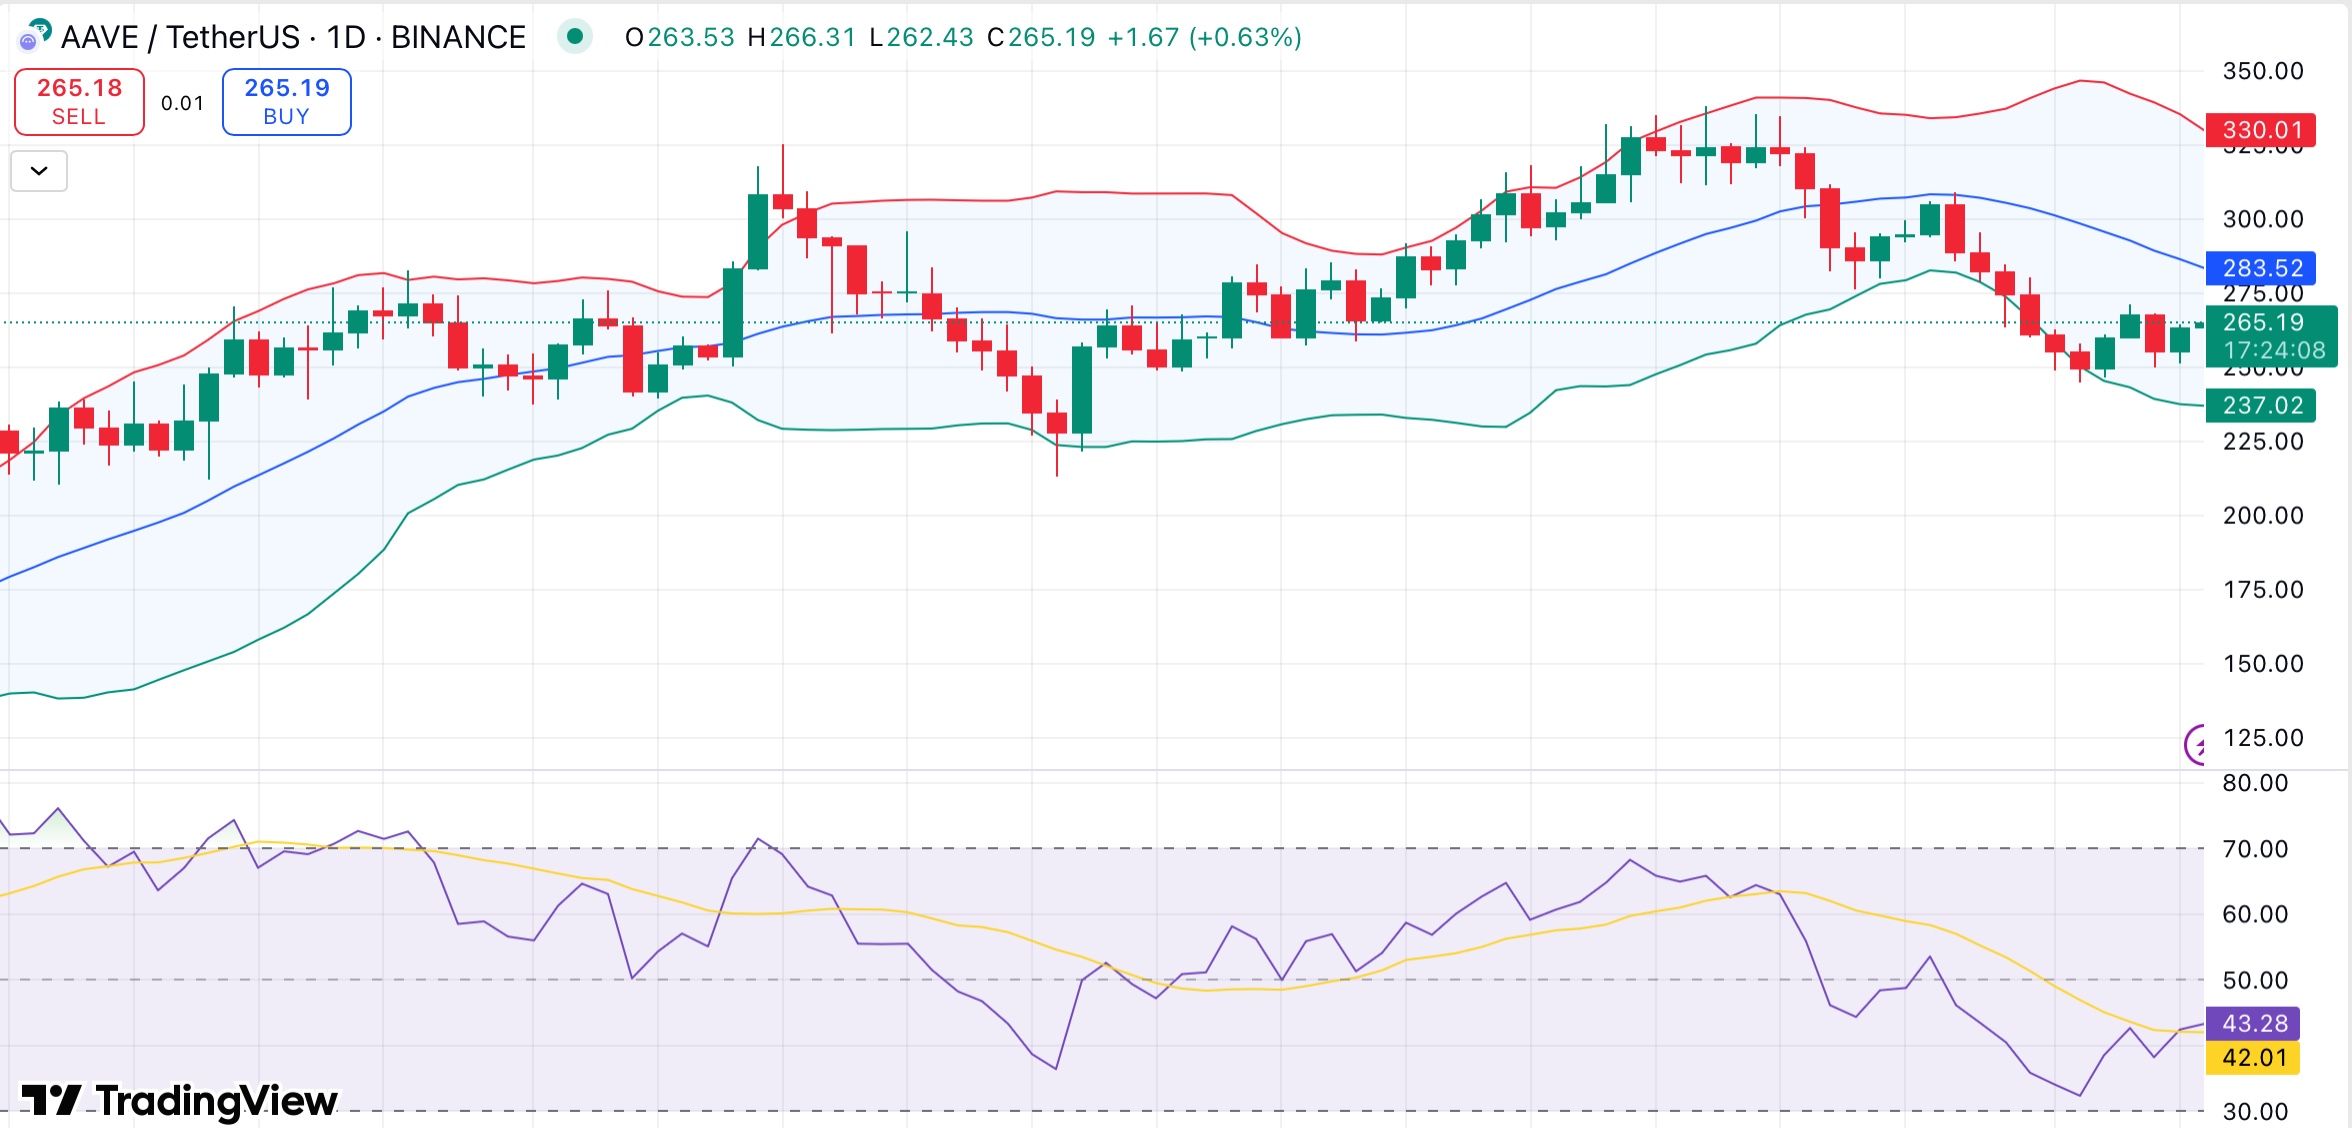
The awesome oscillator and Stochastic RSI are still neutral, but momentum has turned bullish. The lower Bollinger Band, which frequently serves as a local support level during consolidation phases, is just below the price.
A move past the 20-day EMA would be confirmed if AAVE broke decisively above $280, creating space for the next resistance level, which is located between $310 and $315. AAVE might retest June lows around $230 if support around $250–$255 fails.
Downward pressure would probably be accelerated by a drop below the lower Bollinger Band and rising sell-side volume.
Source link