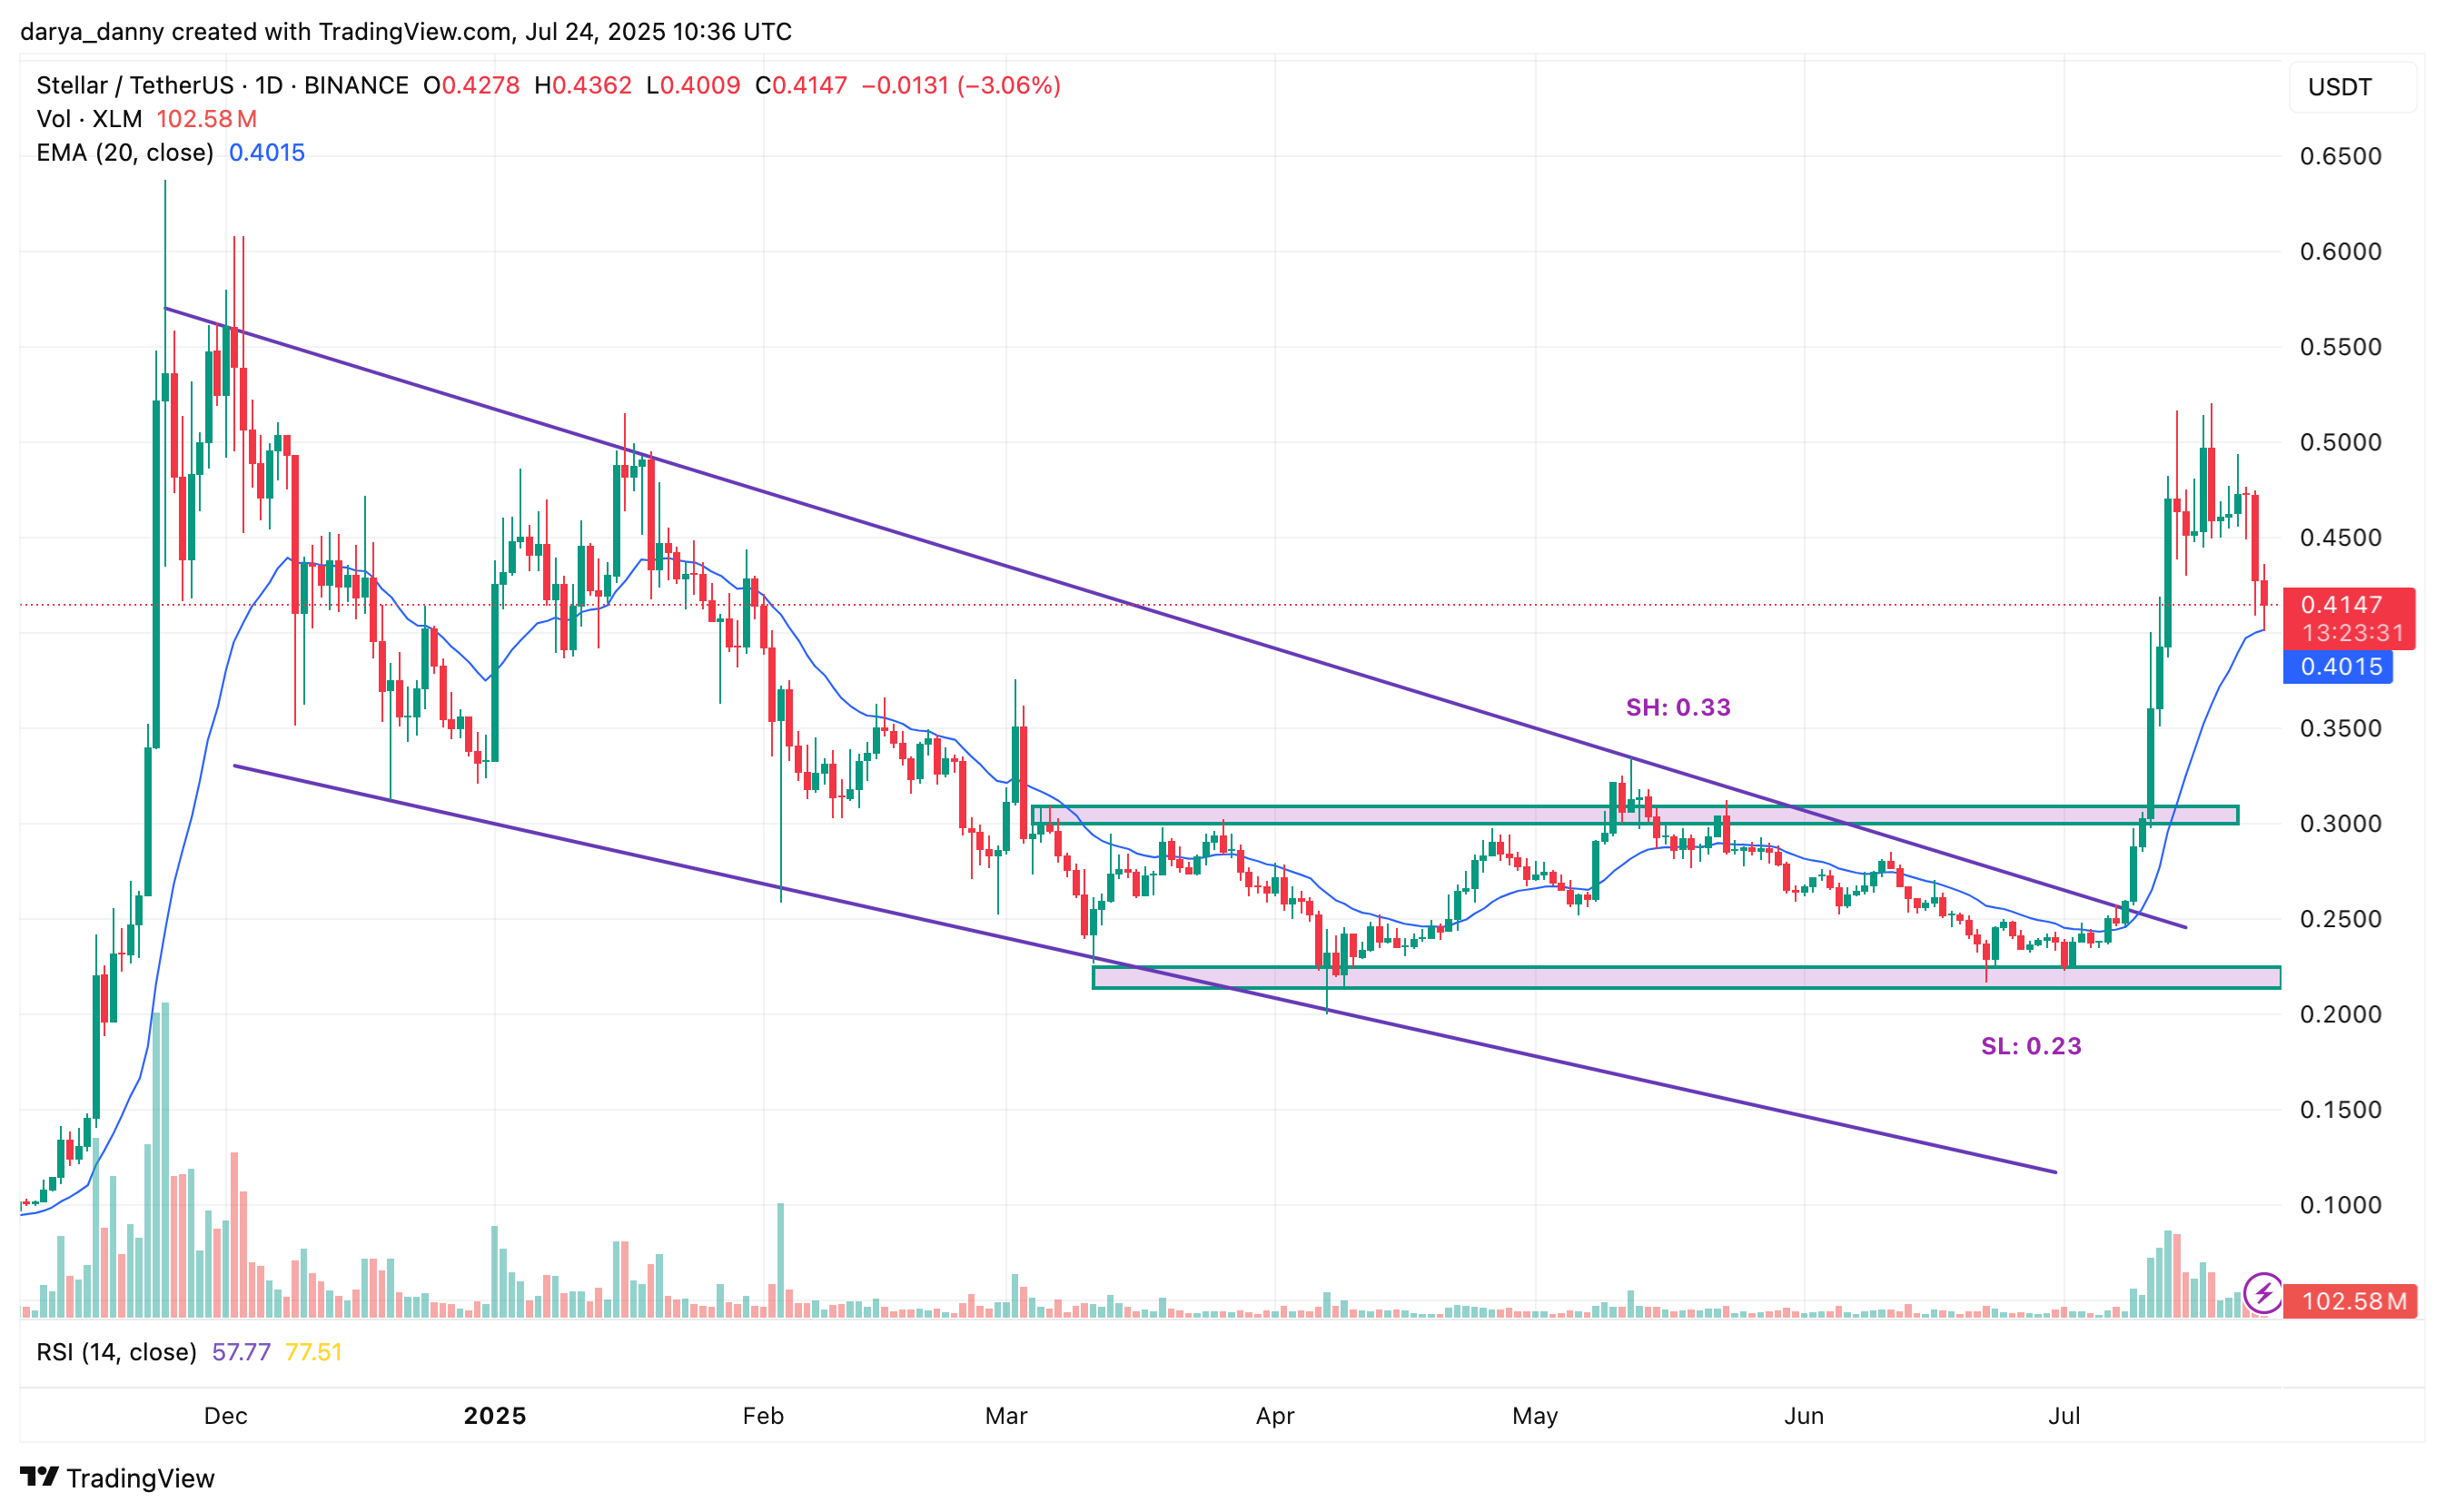
XLM price is cooling off after a sharp rally to $0.52, but key support level is holding, keeping the bullish structure intact.
Summary
- XLM broke out above $0.33 resistance after months of consolidation, hitting $0.52 — its highest level since January.
- Rally was fueled by a surge in Stellar’s stablecoin supply and futures open interest .
- Price has now pulled back ~10% to $0.42 as traders take profits.
- The $0.33 breakout zone now serves as strong support.
- Overall structure remains bullish but a break below the 20-day EMA could signal a deeper correction.
- Next resistance sits at $0.64, representing a potential 52% gain from current levels.
Stellar (XLM) price has recently staged a massive breakout from both a long-standing descending channel and a horizontal consolidation range, pushing through the key resistance level around $0.33. That breakout propelled XLM price to a multi-month high of $0.52, a level not seen since mid-January.
The move above $0.33, which had served as a stubborn ceiling during months of sideways action, was backed by a notable increase in trading volume, reinforcing the strength of the breakout. However, XLM price has now pulled back to around $0.42, suggesting that traders are taking profits following that breakout rally.
As crypto.news pointed out earlier, XLM’s explosive rally was likely fueled by a surge in the stablecoin supply on the Stellar Network to a record $647M and a sharp rise in futures open interest.

XLM short-term price prediction
Despite the current 10% pullback, the overall structure remains bullish as the price hasn’t broken below the $0.33 breakout zone, a key level that now serves as support after acting as resistance for several months. As long as XLM price holds above this level, the breakout remains intact, and the recent dip is more likely a healthy correction within a larger uptrend rather than a reversal.
Looking ahead, sustained buying pressure could push XLM price to reclaim $0.52 and potentially advance toward the January peak of $0.64, which would be a 52% gain from the current level.
Technical indicators support a cautiously bullish outlook, with the RSI cooling off from overbought levels to 57, and the price holding above the 20-day EMA, which is acting as support during the current pullback. However, a break below this EMA, which the price is currently testing, increases the likelihood of a deeper retracement.

Source link

