


MAMO crashed shortly after it began trading on Coinbase, halting a week-long surge that had pushed the token up over 120%.
Summary
- MAMO dropped nearly 20% after its Coinbase listing, after gaining over 120% earlier in the week.
- Trading volume for MAMO surged 150% over the past day as traders seem to be locking in profits following the rally.
- On-chain data shows a surge in whale accumulation alongside a drop in exchange balances over the past 7 days.
According to data from crypto.news, Mamo (MAMO) hit an all-time high of $0.227 on Thursday, Aug. 7, before dropping nearly 20% as selling pressure mounted. Despite the minor pullback, the token is up over 63% on the weekly time frame and has gained more than 1,300% since its launch in May.
In the past 24 hours, MAMO’s daily trading volume has surged over 150% amid the price drop, a likely indication that traders were rushing to exit positions and take profits after the token’s rapid run-up in the days leading up to its Coinbase debut.
Will MAMO price crash?
Initial sell-offs after an exchange listing are common in the highly volatile crypto market, especially after an all-time high, as early holders often sell their tokens to secure profits.
However, this selling pressure may ease in the short term. Bullish investors could see the price dip as a buying opportunity and begin accumulating at lower levels.
At press time, MAMO traded above its intraday low of $0.171 and showed signs of recovering earlier losses.
Several bullish factors now appear to support the possibility of a near-term trend reversal.
First, MAMO has secured two exchange listings over the past week. With the Coinbase listing now live, the token has gained credibility among U.S. investors, while the CoinEx listing from last week further expands its accessibility to international markets.
Listings on major exchanges often lead to expanded retail access, improved market depth, and broader investor confidence, especially in the U.S. market, where compliance and brand recognition matter.
Second, on-chain data from Nansen shows that whale accumulation remains strong. Over the past seven days, wallets categorized as large holders have increased their MAMO balances by 16.5%, bringing total whale holdings to 2.41 million tokens. This accumulation pattern suggests that high-net-worth entities expect further upside and are positioning accordingly.
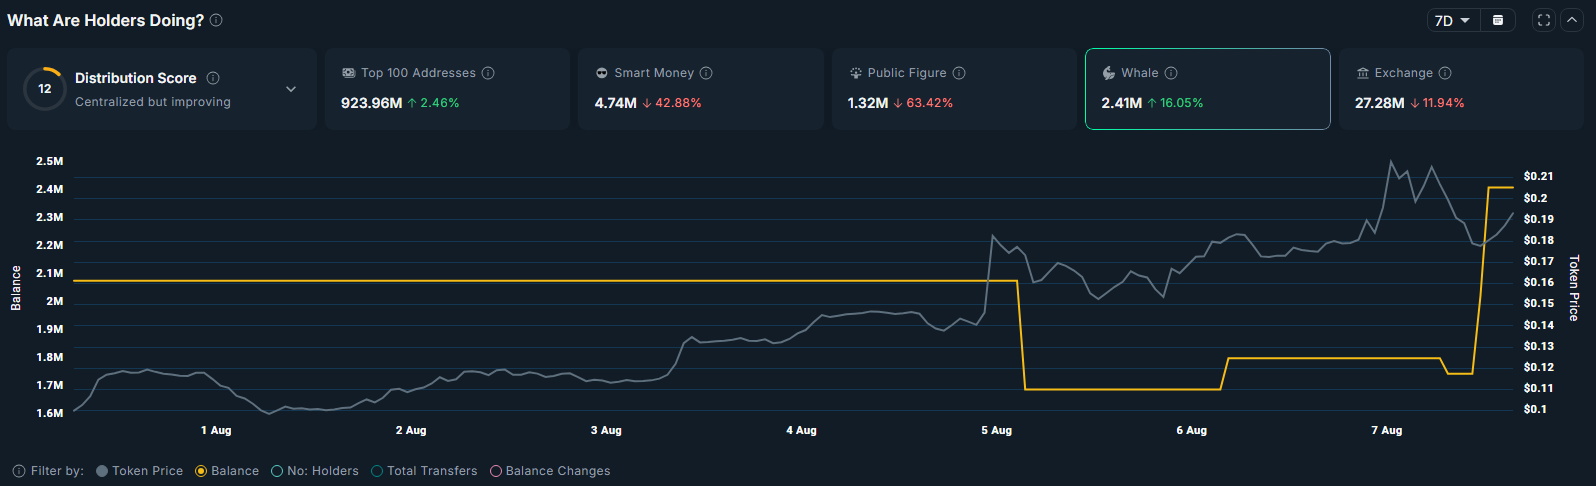
Third, the supply of MAMO on exchanges has decreased by 10.5% over the same period, dropping to 27.7 million tokens. A decline in exchange balances typically signals that traders are moving tokens into long-term storage, reducing available sell-side liquidity. When paired with rising demand, this can create upward price pressure and strengthen the case for a continued recovery.
If market sentiment remains positive and liquidity continues to grow, the token could likely attempt another breakout above its recent all-time high.
MAMO price analysis
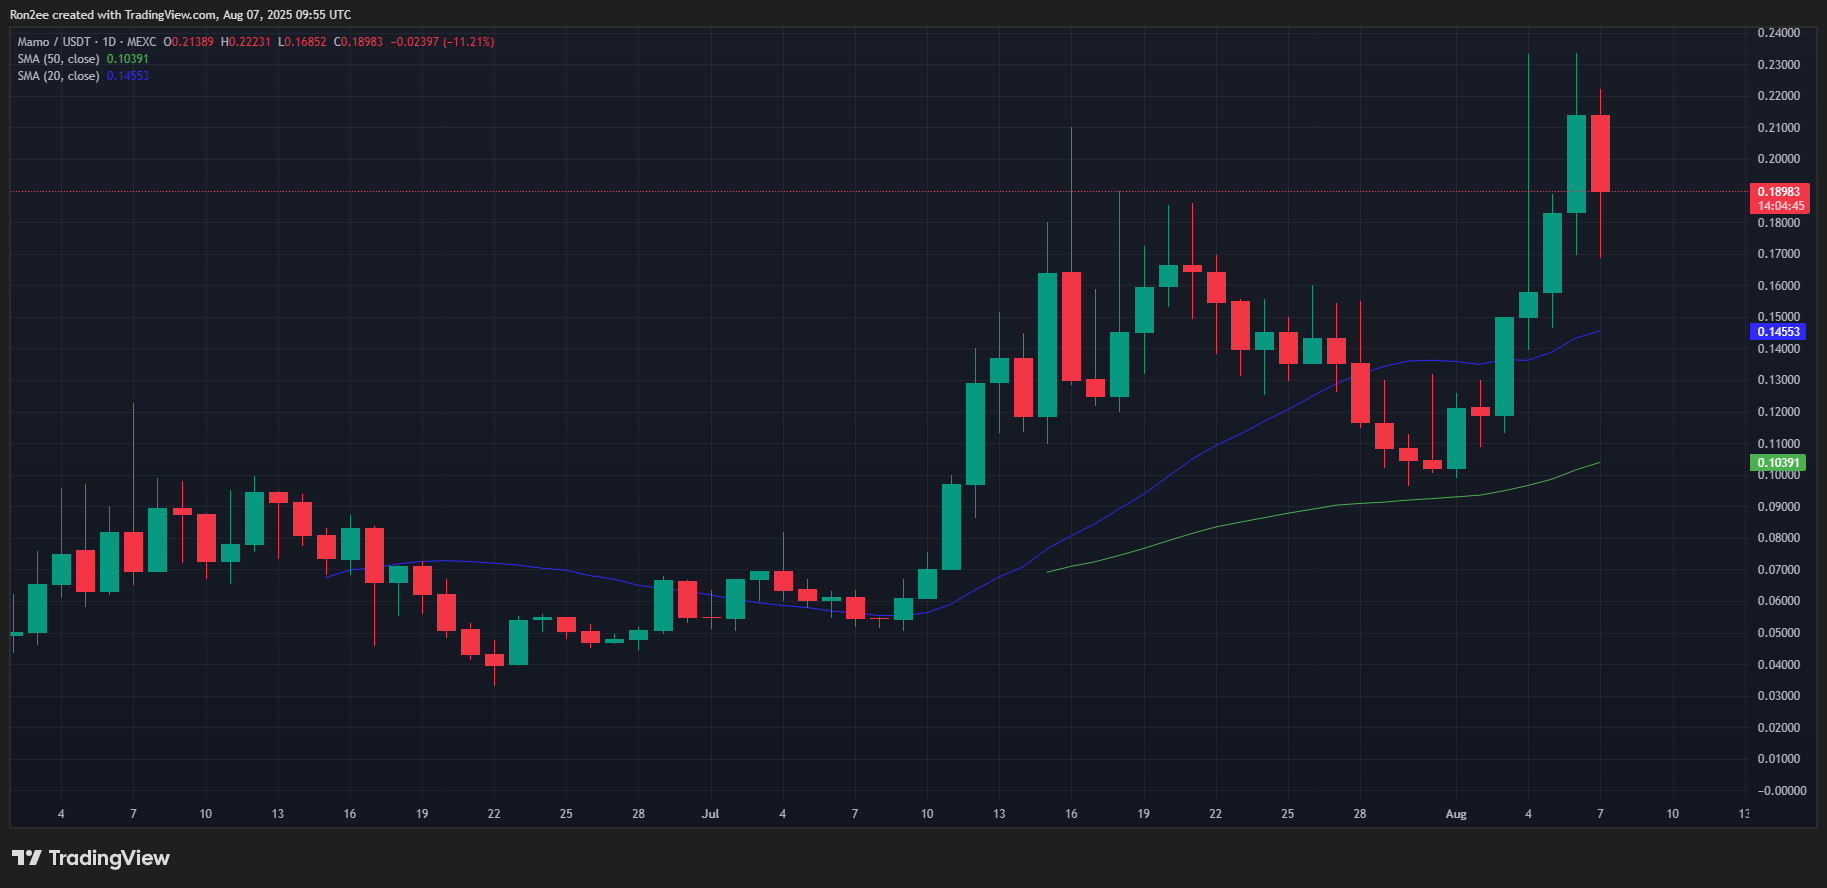
On the daily chart, MAMO remains above both the 20-day and 50-day simple moving averages, a technical signal that supports the continuation of its current uptrend. These moving averages are often used as dynamic support levels, and staying above them suggests that bullish momentum remains intact.
The MACD indicator further reinforces this view, with the MACD line crossing above the signal line, accompanied by expanding green histogram bars. This crossover typically reflects growing bullish momentum and suggests that upward price pressure may continue in the near term.
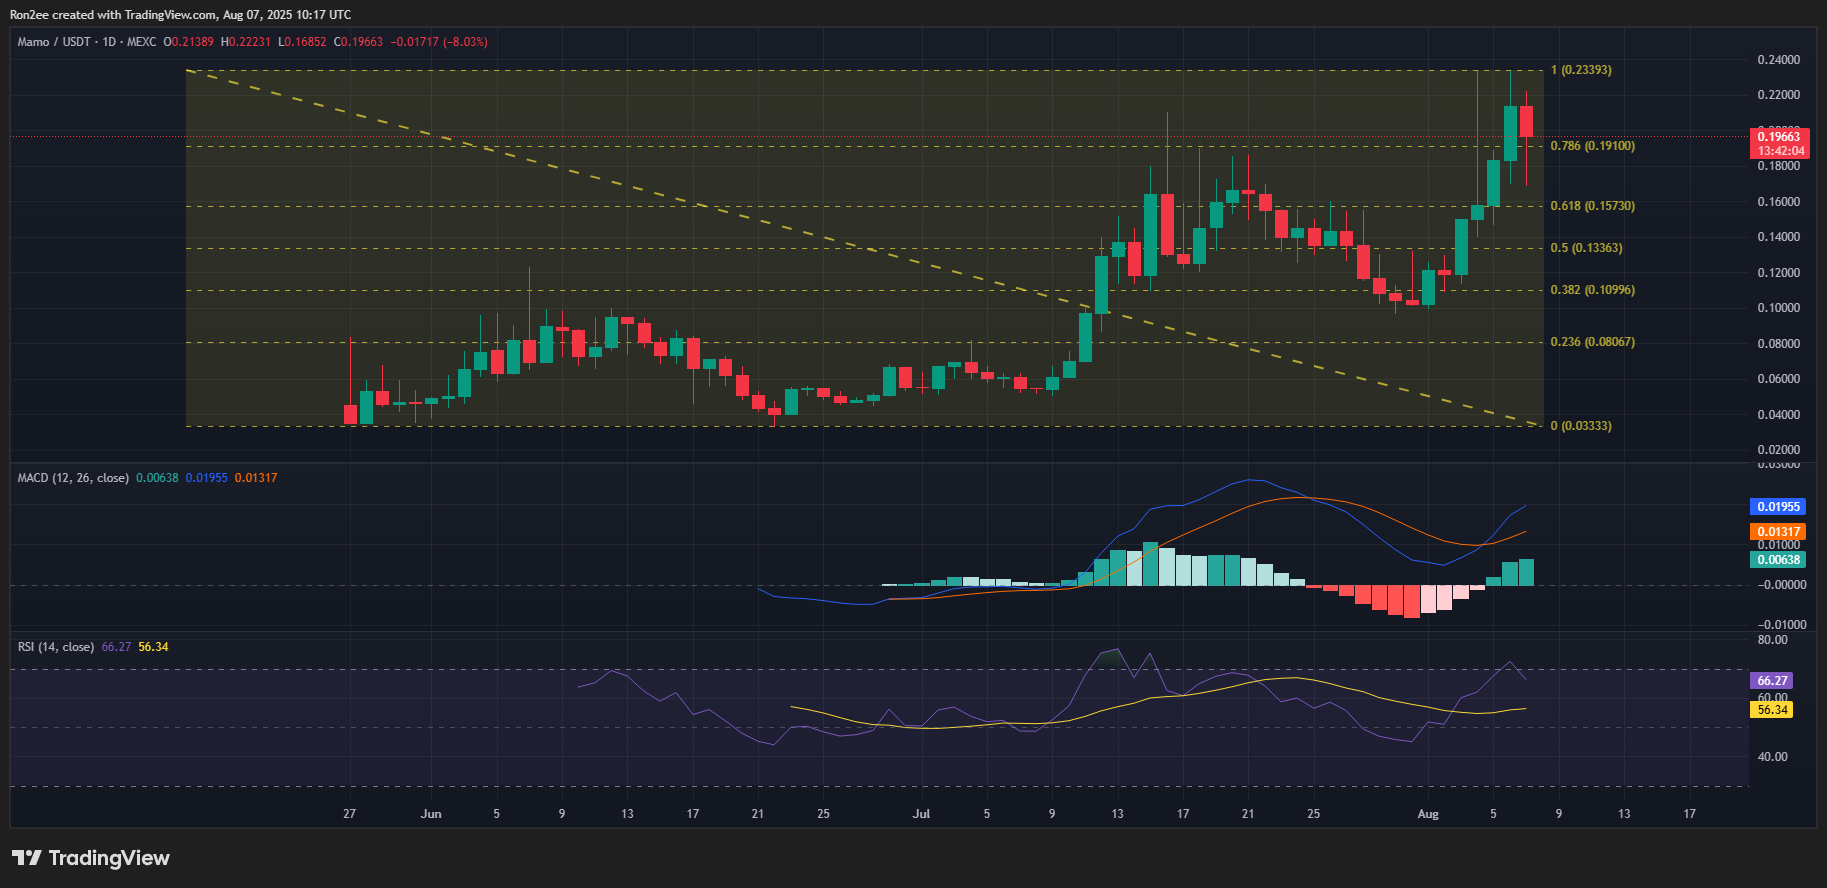
Meanwhile, the Relative Strength Index, which helps gauge overbought or oversold conditions, has pulled back to a reading of 64 after exceeding 70 in the previous session, an area typically considered overbought. The current downward slope in the RSI indicates cooling momentum, though it remains in neutral-to-bullish territory.
As of press time, MAMO was trading near the 78.6% Fibonacci retracement level measured from its recent high to the local swing low.
A successful bounce from this level could see it flip into support, potentially encouraging bullish traders to re-enter and retarget the all-time high. A confirmed breakout above this zone could lead the token into price discovery, with the next psychological resistance level near $0.25 acting as a possible upside target.
Conversely, a drop below the 61.8% Fibonacci retracement level could invalidate the bullish setup. In that case, increased selling pressure may emerge, potentially pushing the token down toward the $0.10 psychological support level, especially if broader market sentiment weakens.
Disclosure: This article does not represent investment advice. The content and materials featured on this page are for educational purposes only.
Source link