


The Pi crypto price has been in a freefall this month, continuing a trend that began late in November.
Summary
- Pi Network price continued its freefall, reaching its lowest level since Nov.5.
- The daily volume of Pi plunged by 11% to $14 million, a sign of weak demand.
- This trend is happening after an investor filed a lawsuit against the developers.
Pi Network (PI) token dropped to $0.2145, its lowest level in almost a month. It has dropped by ~25% from its November high, indicating it has entered a local bear market.
The token has dropped as third-party data shows that its demand has largely dried in the past few days. According to CMC, its 24-hour trading volume fell 15% to $14 million, a relatively small amount for a large cryptocurrency with a fully diluted valuation of over $21 billion.
Most of its volume was on OKX, one of the biggest cryptocurrency exchanges in the industry. Bitget, Gate, and MEXC followed it.
One potential reason why the coin’s volume has dropped sharply in the past few days is a recent lawsuit against the team by an American investor who claims to have lost money betting on the token.
However, some analysts have poked holes in the lawsuit, pointing to some inaccurate statements. For example, he notes that the token’s price dropped from $307.49 to $1.67, which is inaccurate as it peaked at $2.99 in February.
The plaintiff could be citing the price of Pi Network’s IoU, which was used to trade before the mainnet launch in February. Pi Network’s team had nothing to do with these IoUs.
Meanwhile, the plaintiff argued that 5,137 coins were moved from his wallet without his knowledge, something that will be hard to prove in court. Pi’s team has yet to respond to the lawsuit.
Pi crypto price technical analysis
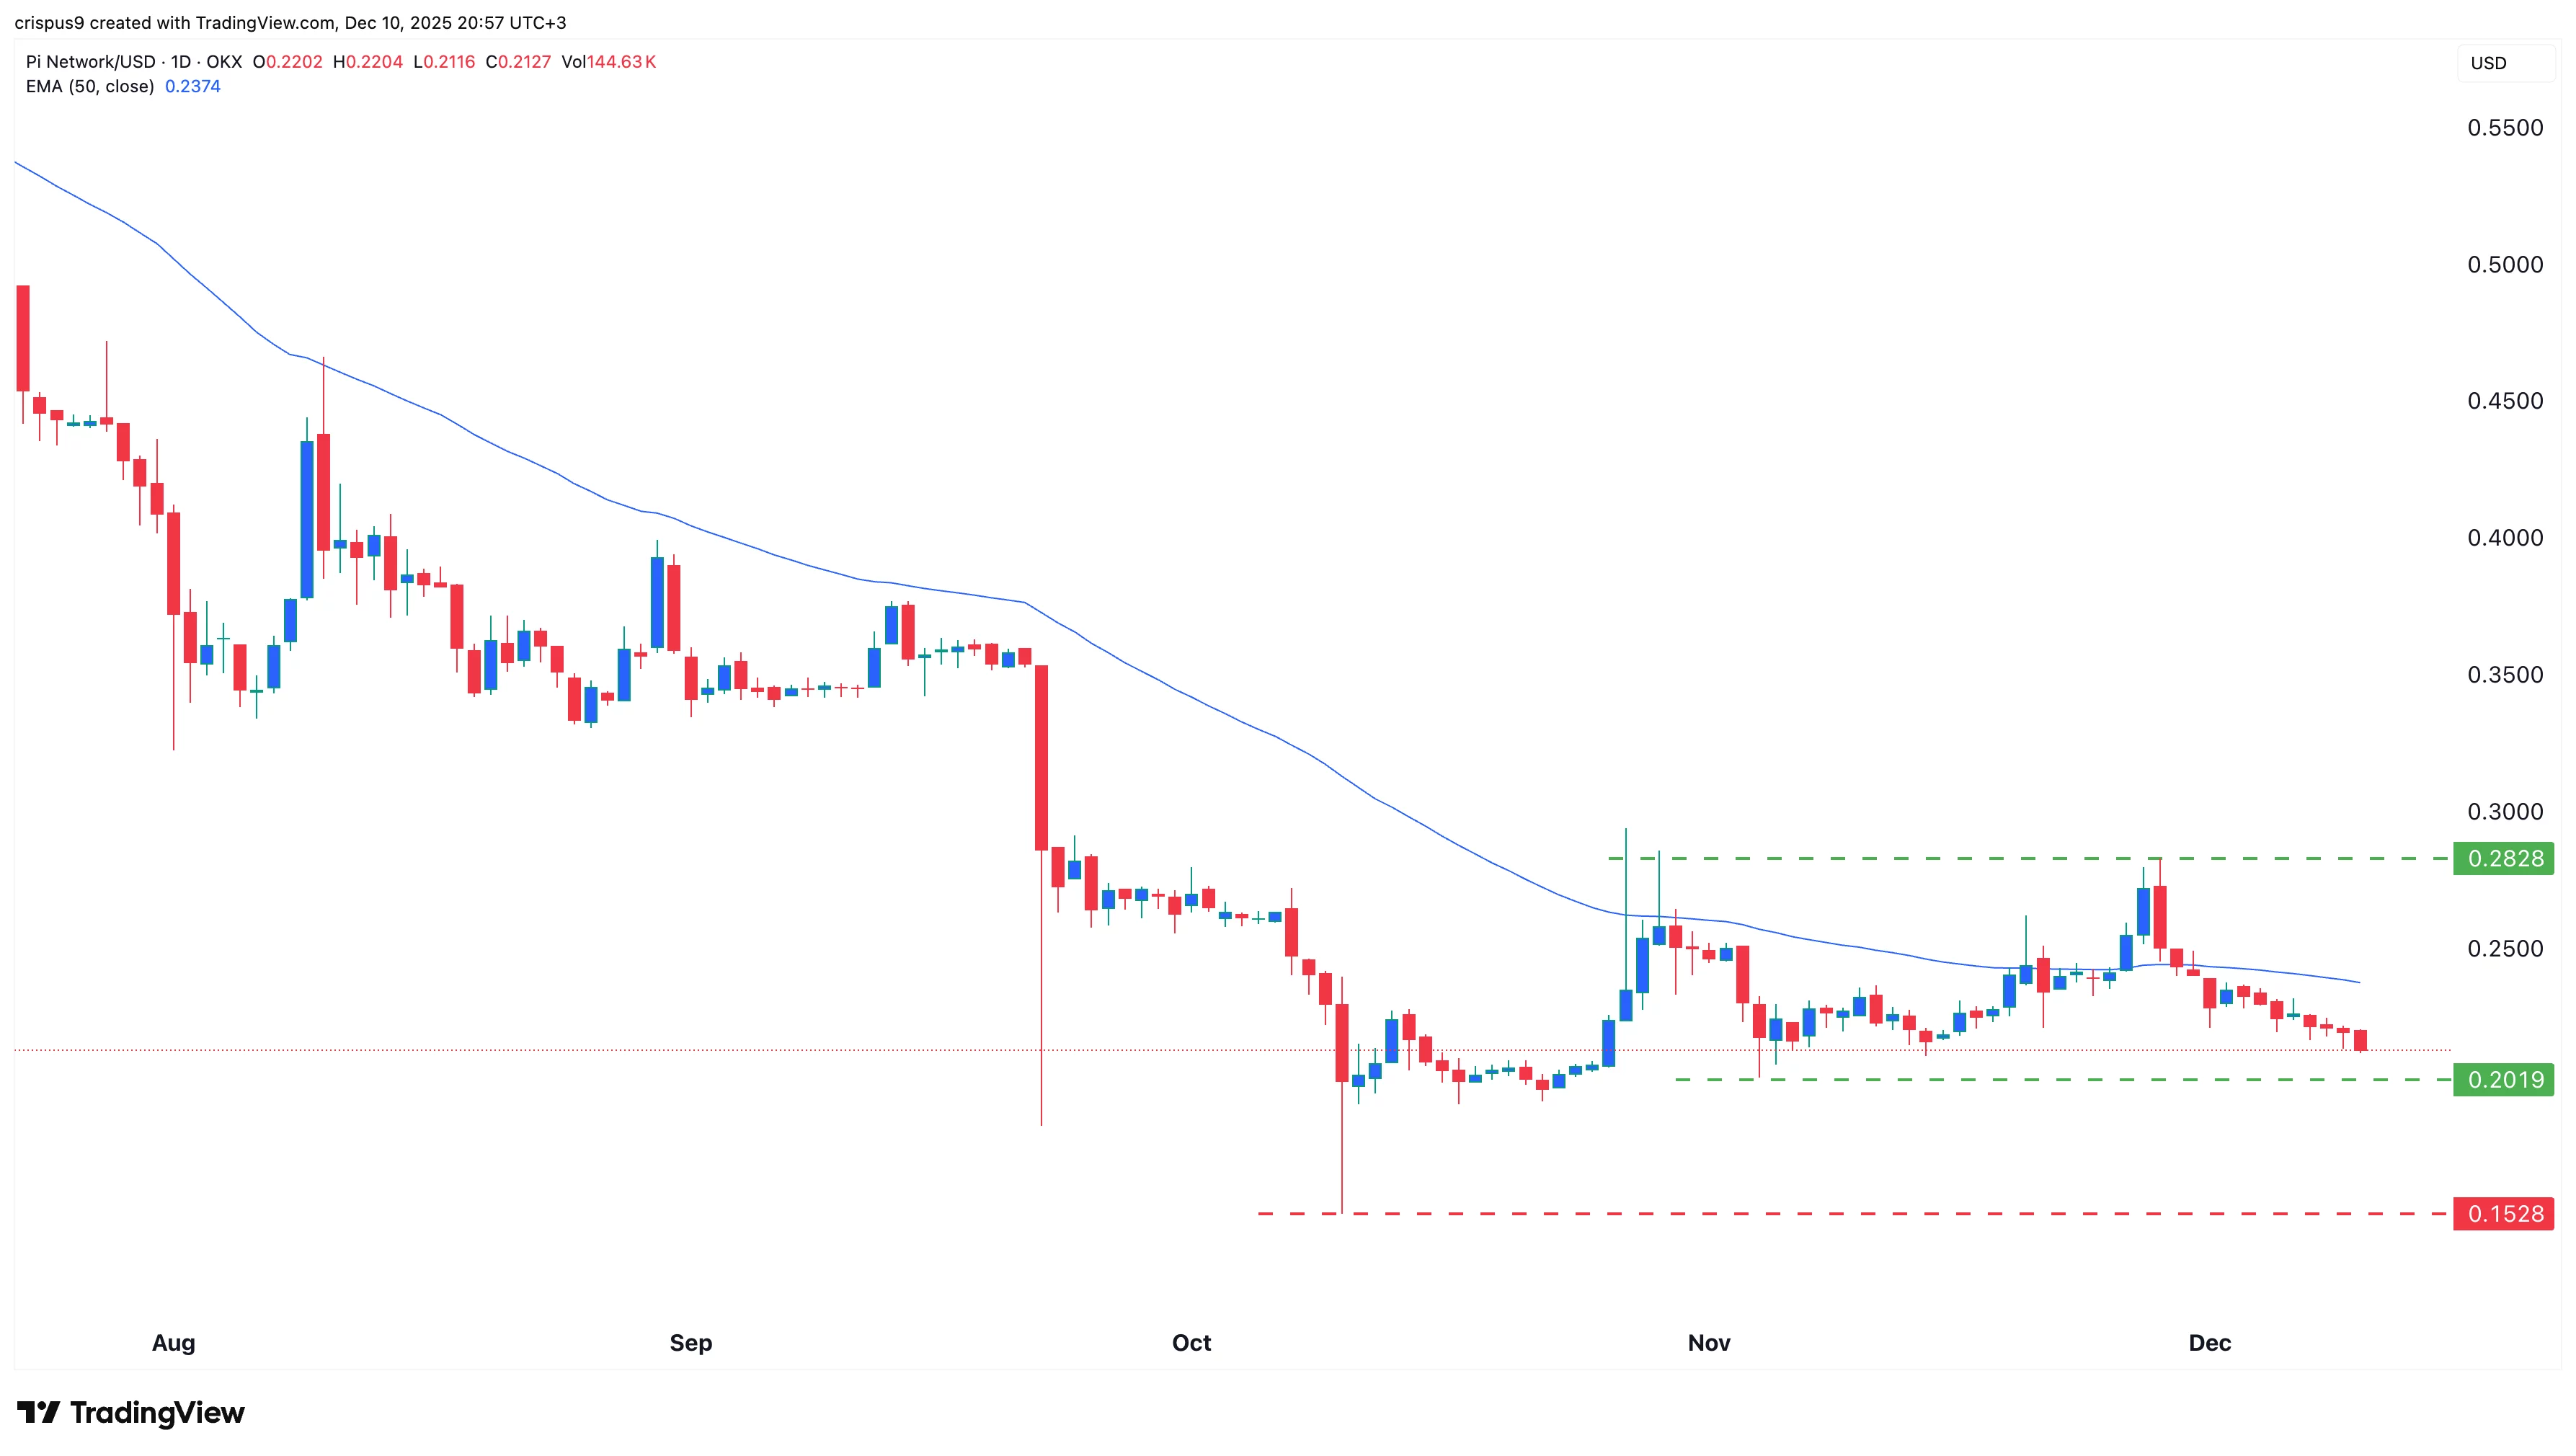
The daily timeframe chart shows that the Pi crypto price has sold off sharply over the past few days, as investors booked profits after the strong performance in November.
It has formed a double-top pattern at $0.2828 and is now nearing the neckline at $0.2020, its lowest level in November. Moving below that level will signal further downside, as it will confirm the double-top pattern.
A drop below that level will likely trigger further selling, potentially to the next key support level at $0.1530, its lowest in October this year. The bearish outlook will be invalidated if it rises above the 50-day moving average at $0.2375.
Source link