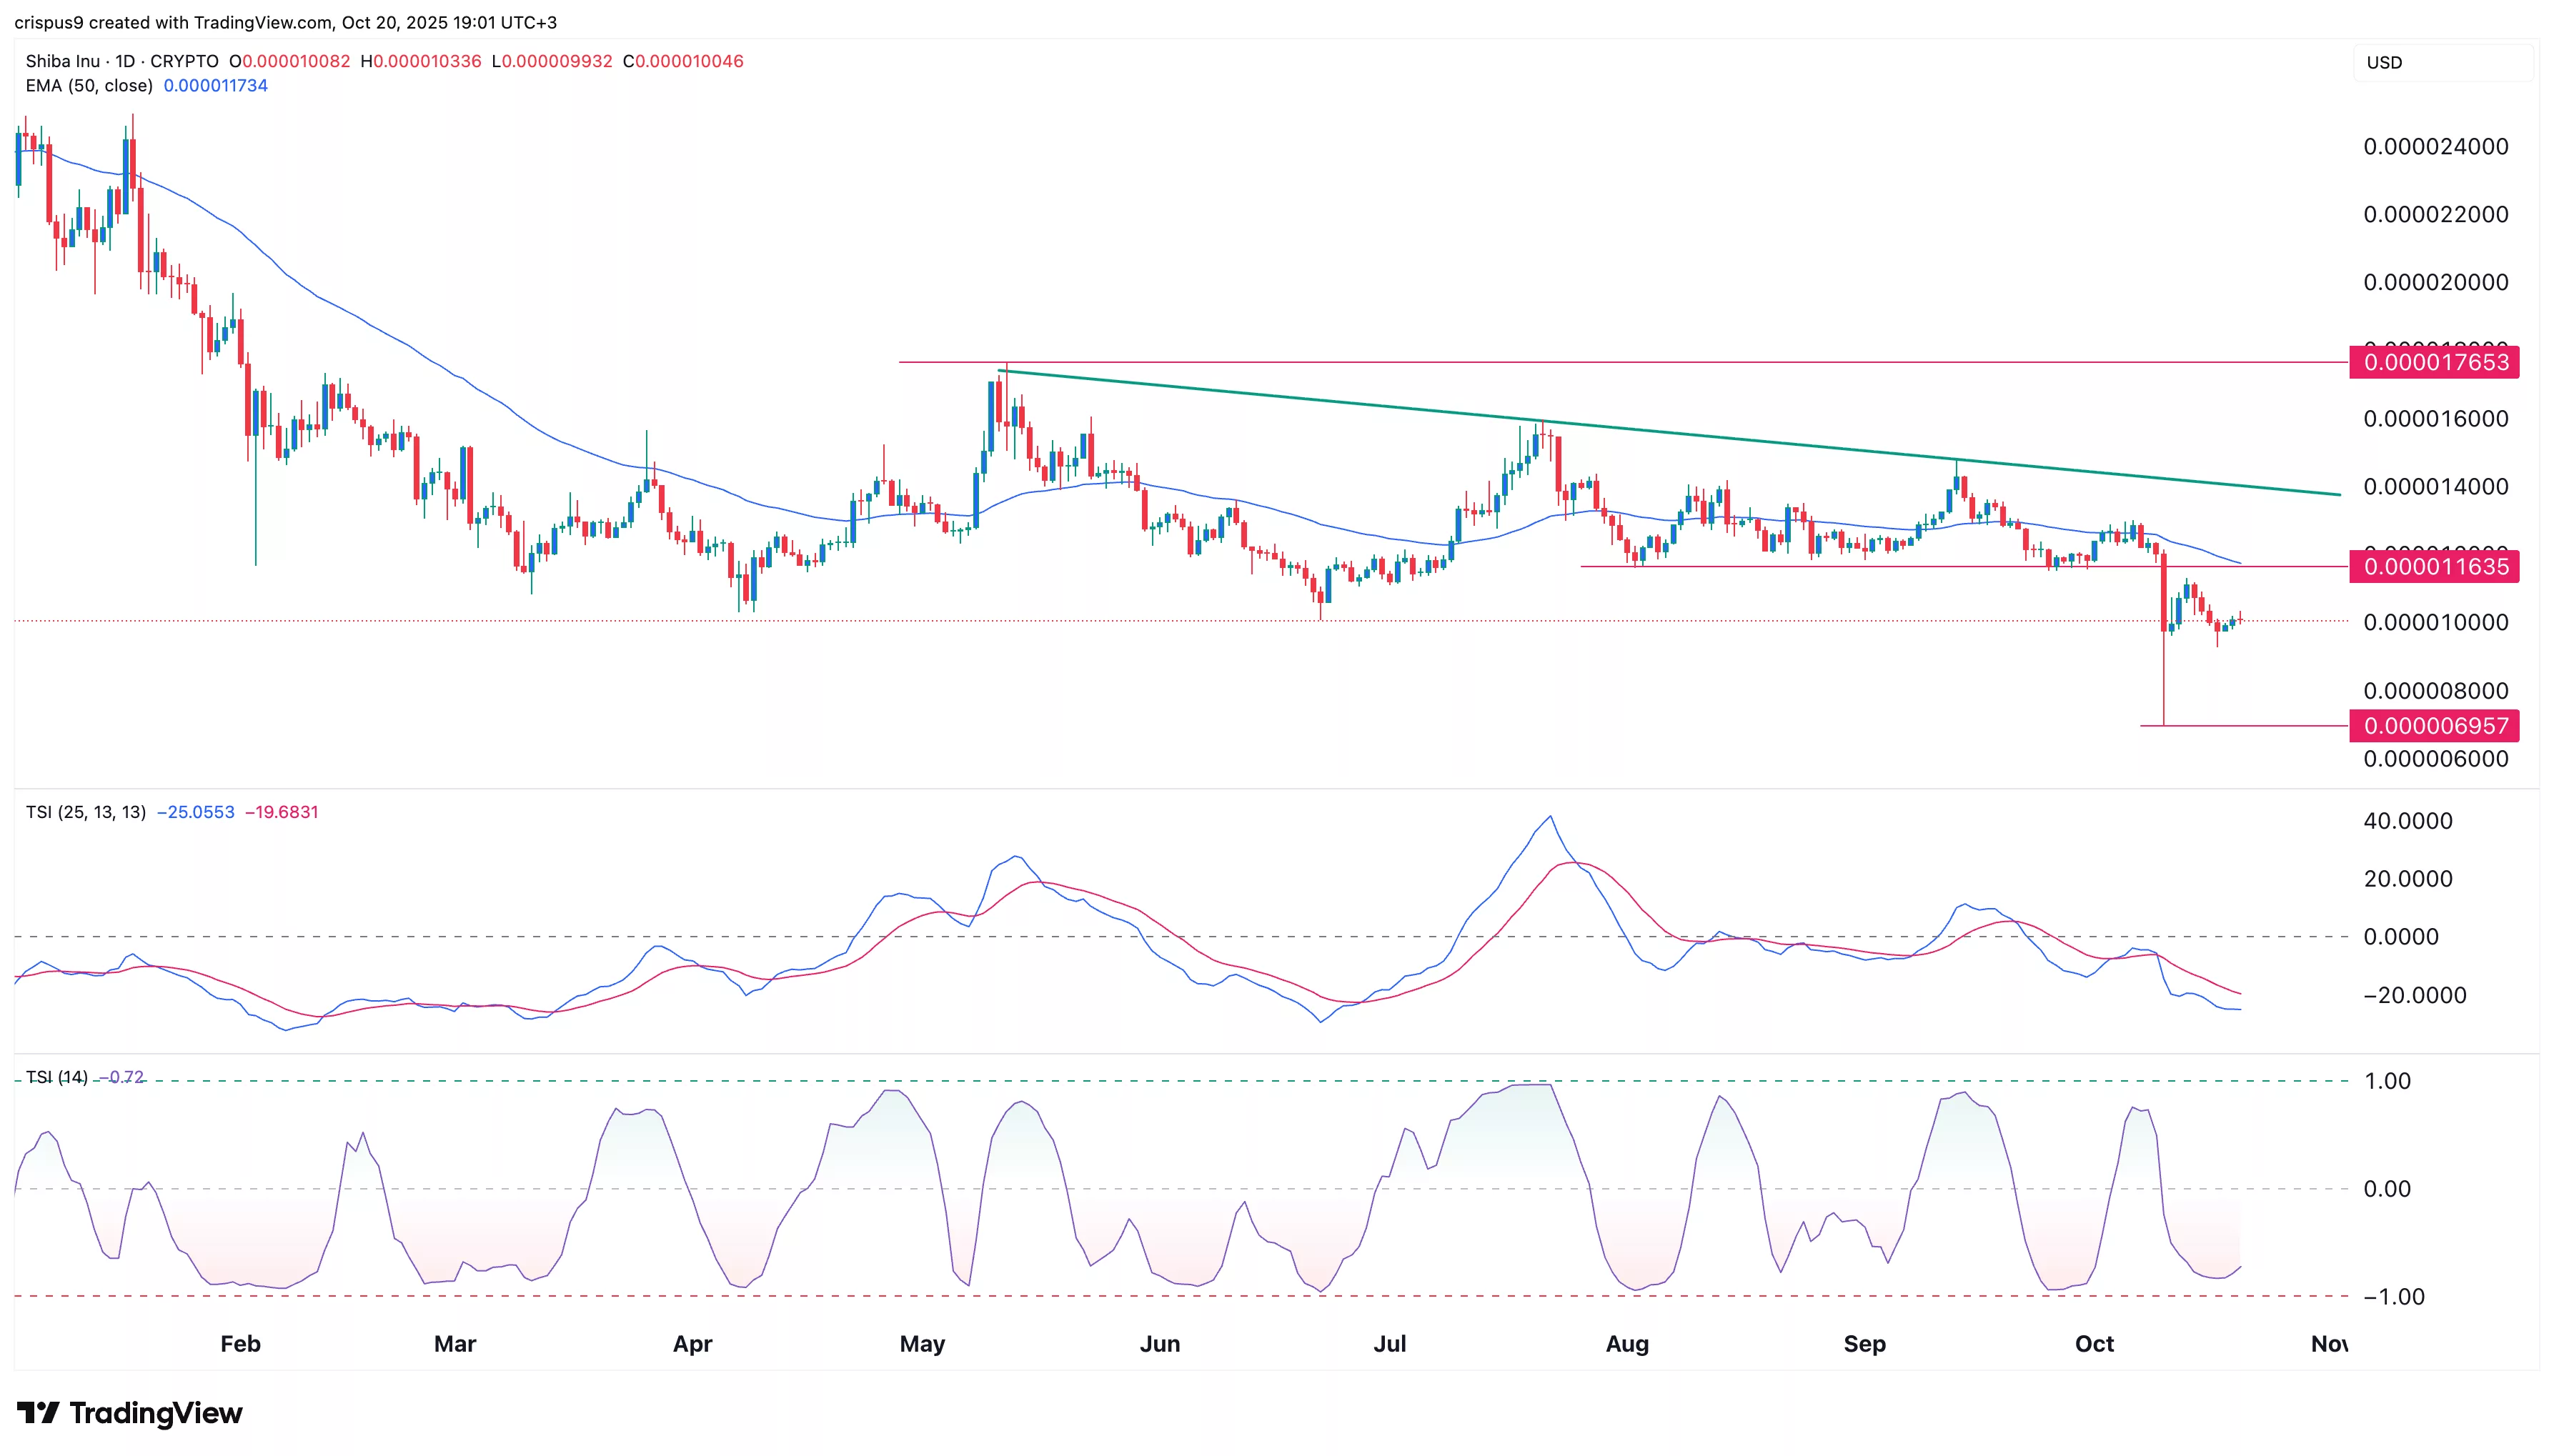
Shiba Inu price has rebounded by over 47% from its lowest point this month, coinciding with the performance of Bitcoin and other altcoins.
Summary
- Shiba Inu price could be at risk as the burn rate slips.
- Whales and smart money investors have continued selling.
- Shibarium’s growth has stalled this year, with its TVL slumping to below $1m.
Shiba Inu (SHIB) token rose to $0.000010, up by 10% from its lowest point during the weekend. It has underperformed other tokens like Zcash and Synthetix that have had bigger gains in the past few days.
SHIB price rally could be at risk as the burn rate plummeted, smart money and whale investors sold, and the strength of the rebound remained weak.
Data shows that the token’s burn rate plunged by 99% to 69,530 tokens in the last 24 hours. These tokens are currently worth less than a dollar.
One reason why the burn rate has plunged is that Shibarium’s growth has decelerated. The total value locked in the network has plunged by 43% in the last 30 days to $873,820. This plunge accelerated after the recent ShibaSwap hack.
Worse, while Shibarium has had almost 300,000 accounts, the active ones have plunged to below 500. The network’s fees are less than $10 a day. Part of this fees, which is in the form of BONE, is converted into SHIB and burned.
Whales and smart money investors have continued to reduce their SHIB positions. Smart money traders have dumped 10% of their tokens in the last 30 days to 46.80 billion, while whales have reduced their tokens from 231 billion tokens on Oct. 12 to 117 billion.
Shiba Inu price technical analysis

The SHIB token has pulled back in the past few months, moving from a high of $0.00001765 in May to $0.000010 today. It remains below the important resistance level at $0.00001163, the lower side of the descending triangle pattern.
The coin has moved below the 50-day and 100-day Exponential Moving Averages. Also, while the coin has risen in the last three days, the two lines of the true strength index remains below the zero line.
The TSI indicator is used to measure the strength of a trend by using two EMAs. Similarly, the trend strength indicator has continued falling.
Therefore, the token will likely resume the downtrend and possibly retest the year-to-date low of $0.00000695.

Source link

