Solana, the popular layer-1 network, is seeing strong network activity that may help its price jump to $200 and above.
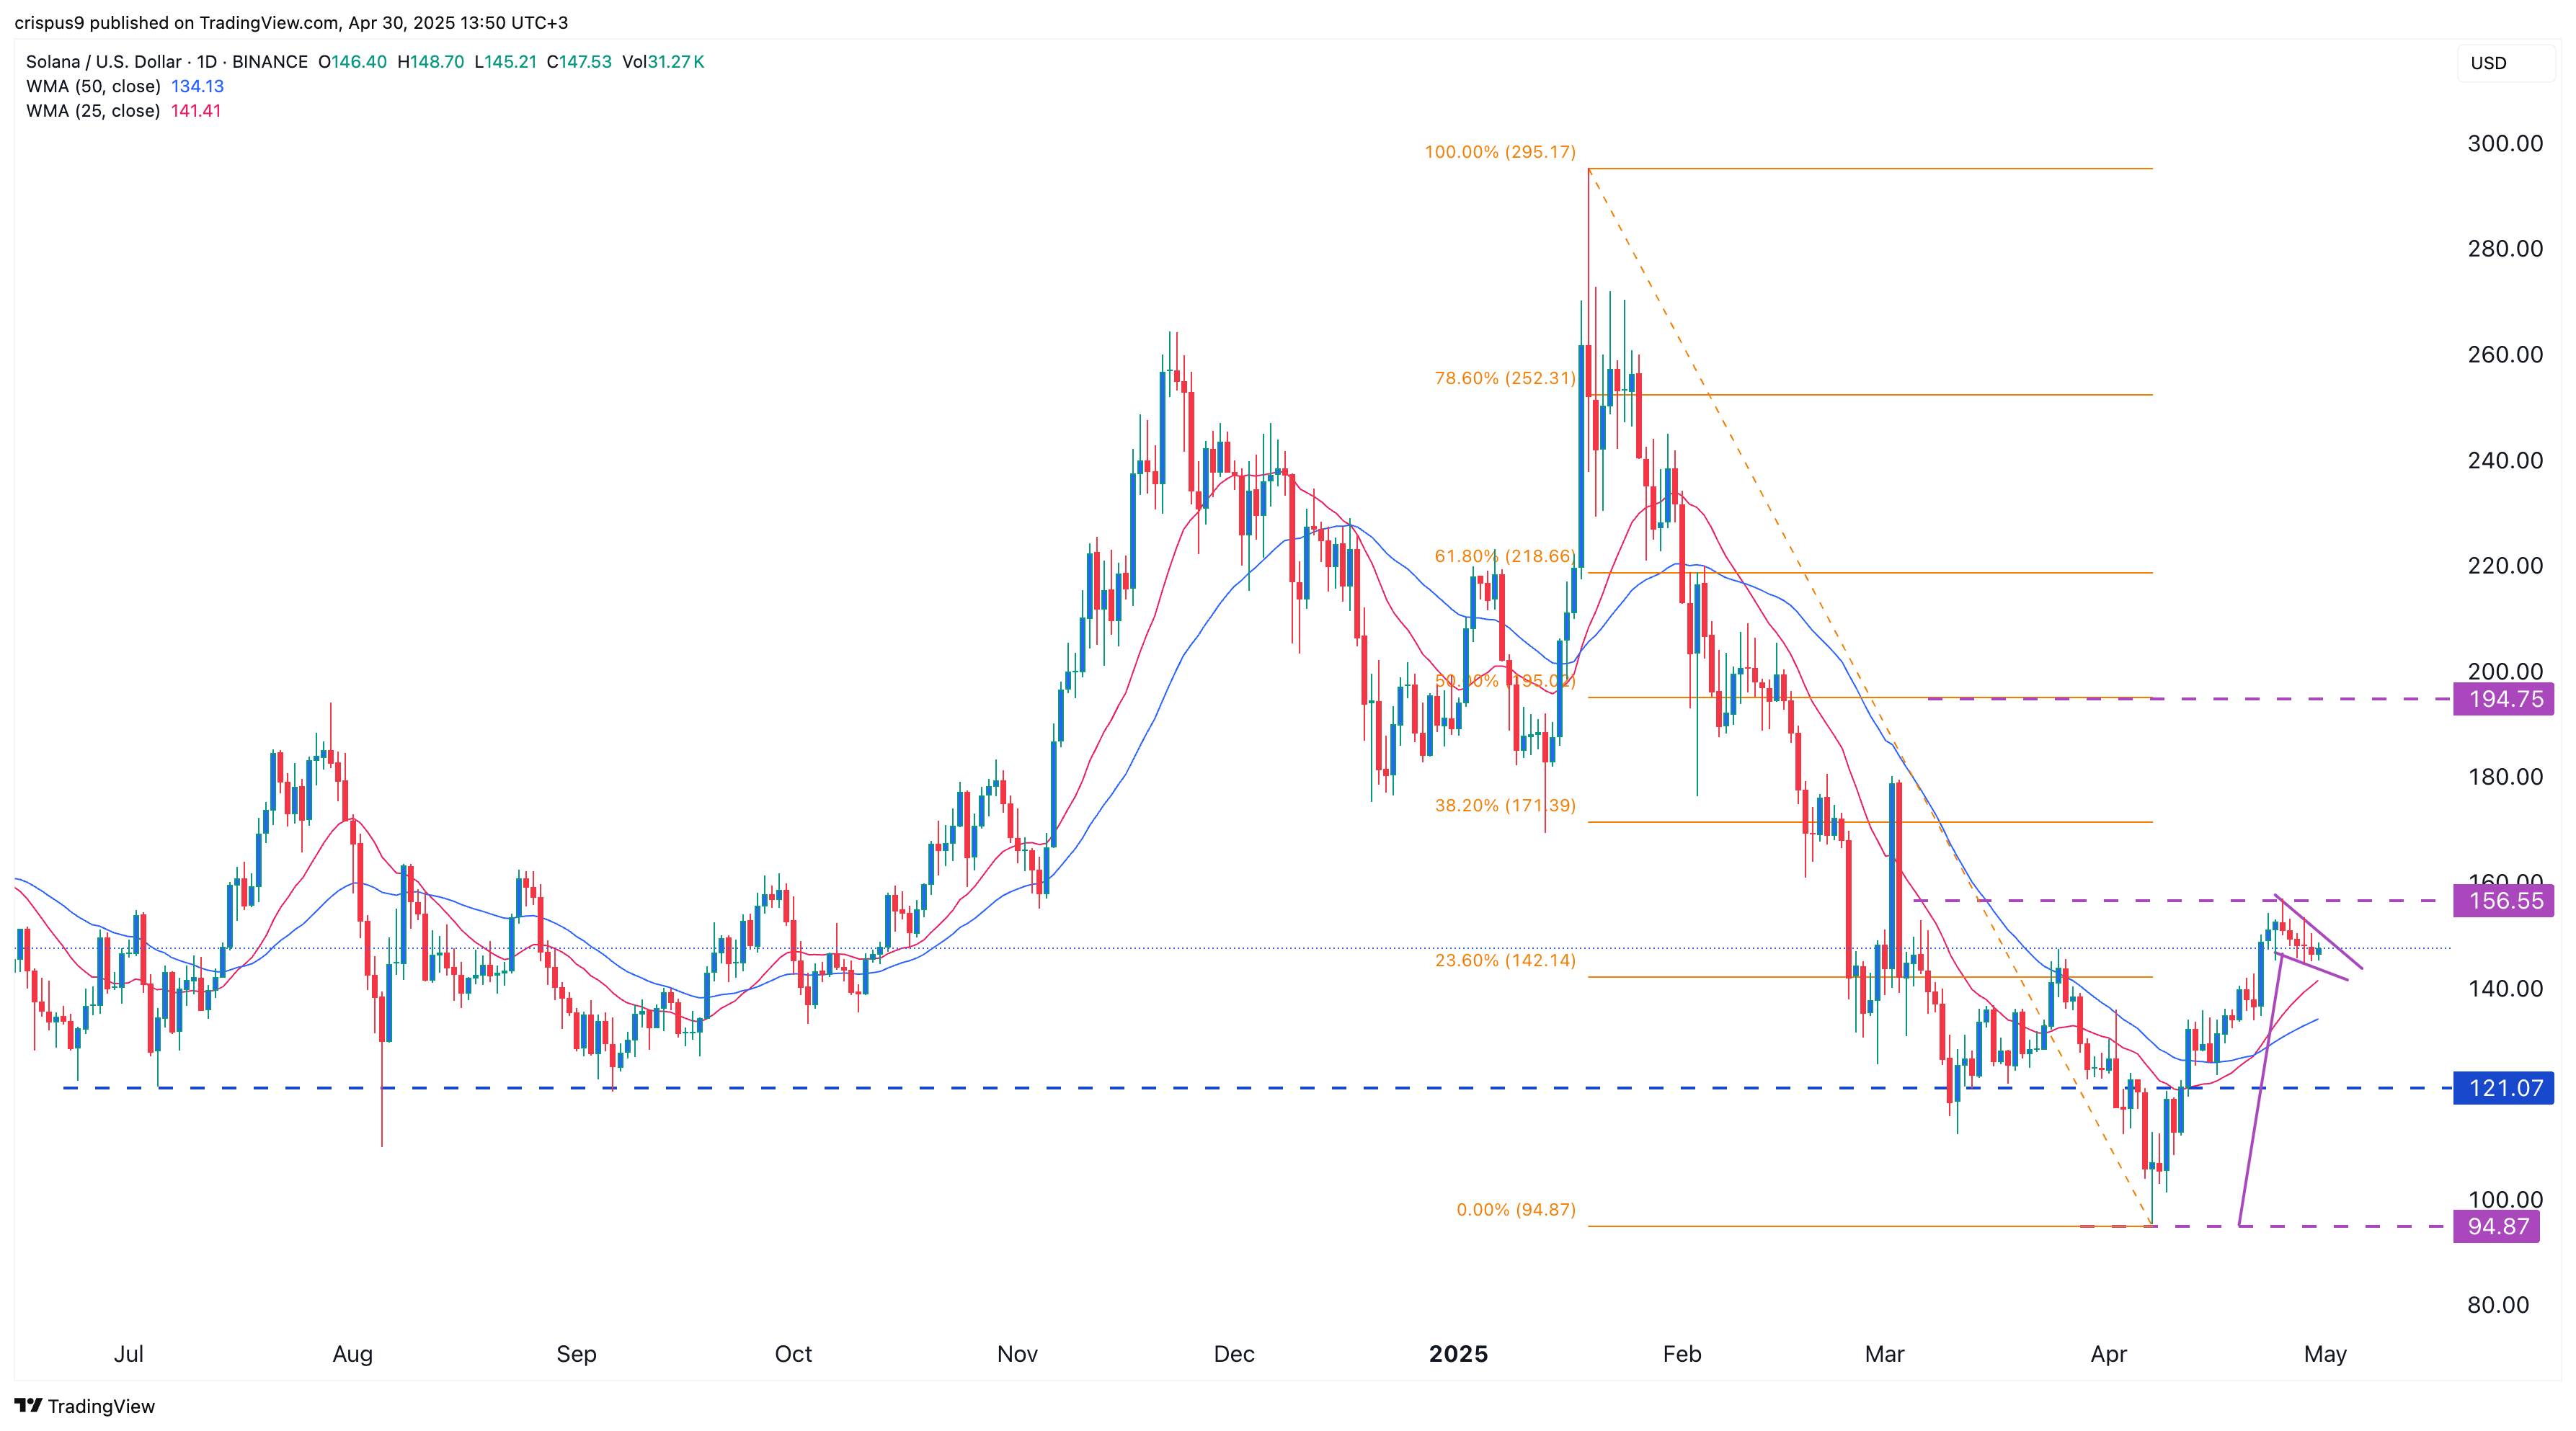
Solana (SOL) was trading at $147.25 on Wednesday, just below last week’s high of $156. It has jumped by over 52% from its lowest level this year.
Third-party data indicates that Solana’s network is performing well, and significantly outperforming Ethereum (ETH) in several key metrics.
According to Nansen, Solana processed over 410 million transactions in the last seven days, representing a 10% increase from the previous week. This uptick likely occurred as top meme coins in its ecosystem, such as Fartcoin, Dogecoin, Bonk, and Official Trump, all surged.
The spike in transactions led to a 22% increase in fees collected by the network, generating over $9.3 million in that period.
In contrast, Ethereum handled over 8.6 million transactions during the same timeframe, making Solana 47 times more active. It also generated $4.45 million in fees, significantly less than Solana during this period.
This divergence has been consistent over the last 30 days, with Solana processing 1.58 billion transactions compared to Ethereum’s 36 million.
TokenTerminal data shows that Solana’s network fees have jumped to over $400 million so far this year, while Ethereum has made $241 million.
Solana is also beating Ethereum in other numbers. For example, its decentralized exchange protocols have handled over $68 billion in volume in the last 30 days, while Ethereum’s ones processed $56 billion.
Solana price technical analysis

The daily chart shows that Solana bottomed at $94.87 earlier this month as concerns about its meme coin ecosystem rose. It then recovered and moved to a high of $156.55 last week.
SOL remains above the important support level at $121, the lowest level from June, July, August, and September of last year. It has also moved above the 50-day and 25-day Weighted Moving Averages.
It is currently forming a bullish flag pattern, characterized by a tall flagpole followed by consolidation. This pattern often leads to a strong breakout. If that happens, the short-term outlook turns bullish, with an initial target at the psychological level of $200.
Such a move would represent a 32% increase from the current level. A drop below the support at $121 would invalidate the bullish outlook.

Source link

