


SUI price may continue to see more losses ahead as technicals remain bearish for the asset despite its recent listing on Robinhood.
Summary
- SUI price remained on a downtrend a day after trading went live on Robinhood.
- The token recorded $5.64 million in long liquidations yesterday.
- Stablecoin supply on the blockchain has dropped over the past week.
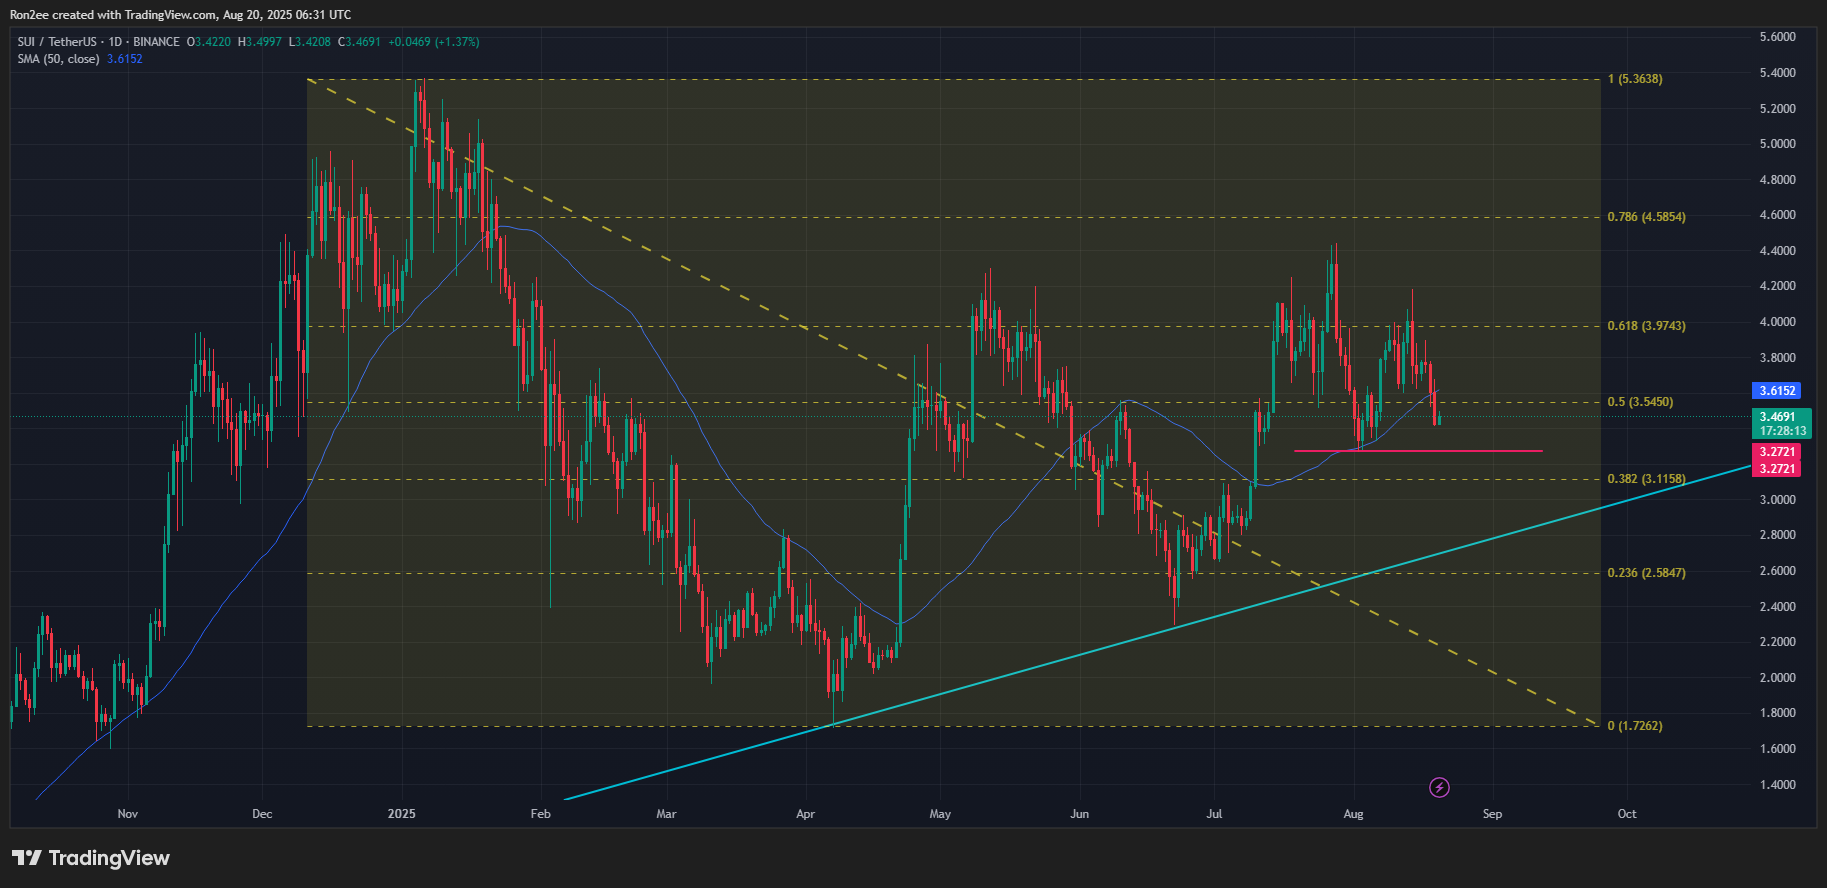
Sui (SUI) token has been in a downtrend since Aug. 17 before entering a consolidation phase in the $3.40–$3.50 range on Aug. 20. As of press time, it was trading at $3.47, down 16% from this month’s high and 34% from its highest point this year.
The SUI token continued to decline after securing a listing on Robinhood, one of the most popular crypto trading platforms in the U.S. While cryptocurrencies typically rally after being listed on such reputable exchanges, SUI’s decline could be part of the broader bearish sentiment in the market, as Bitcoin (BTC) fell below $113,000 and Ethereum (ETH) briefly slipped under $4,100 earlier today.
SUI’s price also plunged as investor sentiment appeared to turn increasingly bearish. According to data from CoinGlass, open interest in SUI futures has dropped sharply—from $2.66 billion in late July to $1.84 billion as of today—indicating reduced speculative activity and waning market confidence.
Additional data shows that the long/short ratio has fallen below 1, signaling that more traders are now positioning for downside moves. This shift in sentiment follows the liquidation of $5.64 million worth of long positions in the last session.
Onchain data from DeFiLlama also showed the Sui ecosystem is not doing so well in recent days. The total value locked in its decentralized finance dropped by 11% in the last 7 days to $3.4 billion.
The total supply of stablecoins on the blockchain has also dropped 16% over the same period, now standing at around $770 million.
Stablecoins form the backbone of on-chain liquidity and trading activity. A decline in their supply often signals reduced capital inflows and user engagement within the ecosystem.
SUI technicals remain bearish
On the daily chart, SUI has fallen below its 50-day moving average, a technical development typically interpreted as a bearish signal by traders.
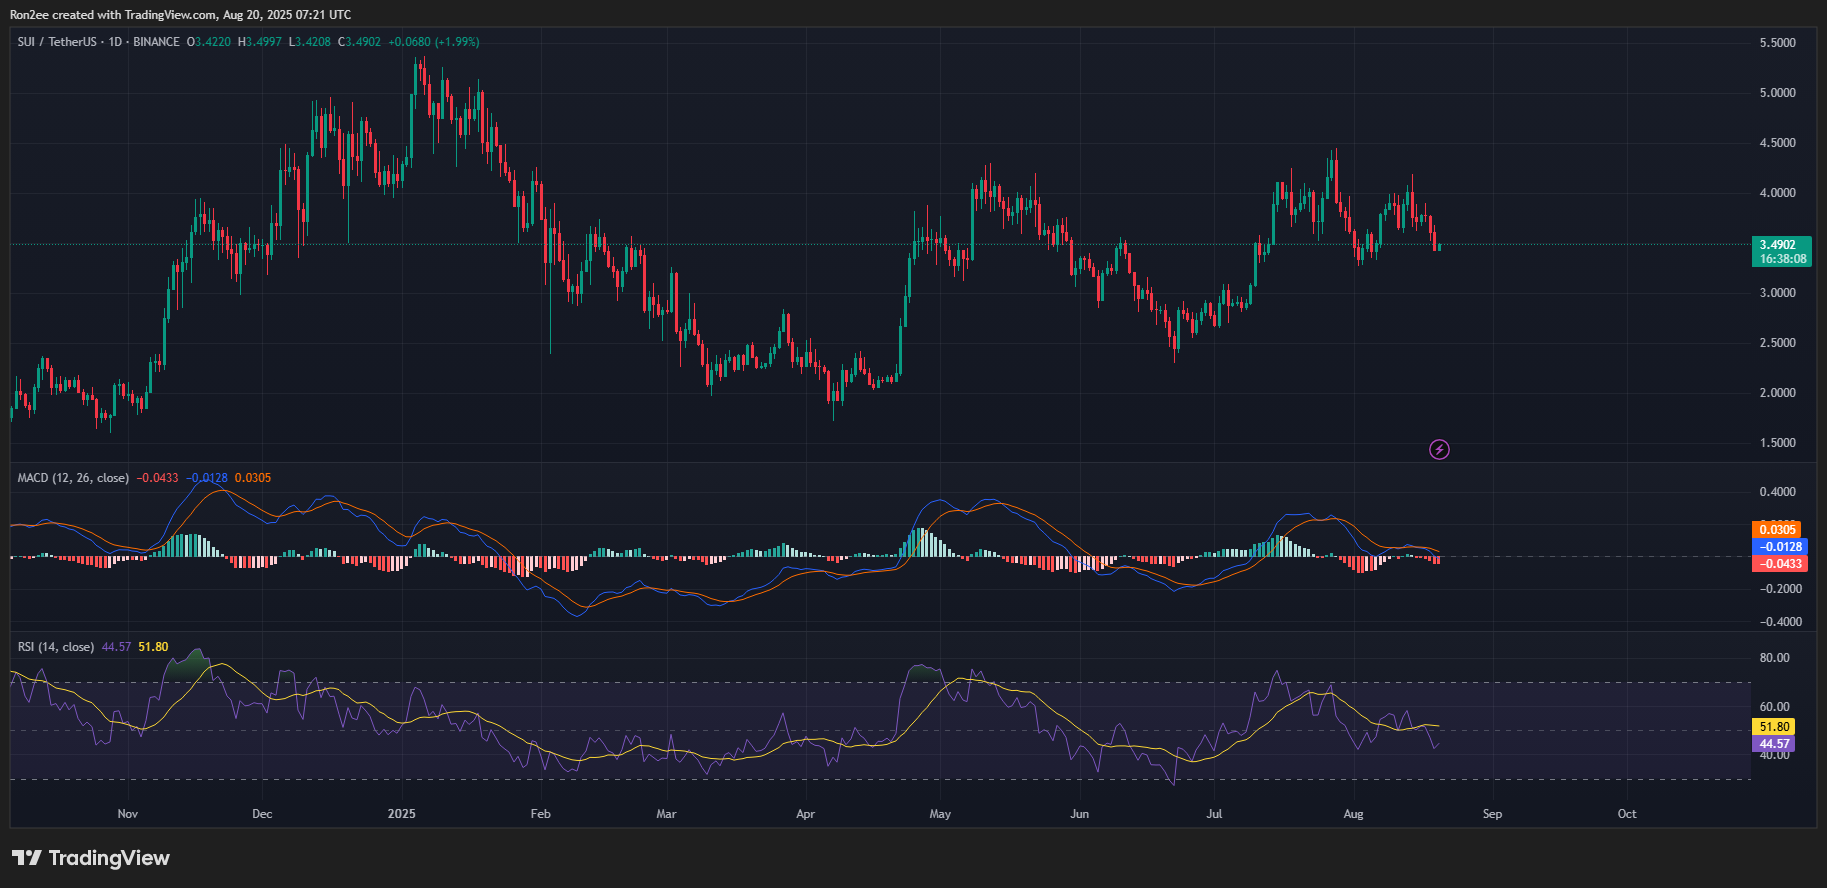
Momentum indicators support this bearish outlook. The Moving Average Convergence Divergence has crossed below its signal line, accompanied by expanding red histogram bars. Meanwhile, the Relative Strength Index has dropped to 44, a sign of increasing selling pressure.
Based on the above bearish signals, SUI could most likely drop to $3.27 support level, which marked the monthly low recorded on Aug. 2. A decisive break below this threshold would likely lead to a drop below the psychological $3.00 level.
On the contrary, a potential bullish reversal remains in the cards if the price tests and rebounds from a rising trendline that has provided support on multiple occasions since April. Historically, SUI has bounced from this trendline each time it has been tested, suggesting it remains a key area to watch for a possible rebound.
Disclosure: This article does not represent investment advice. The content and materials featured on this page are for educational purposes only.
Source link