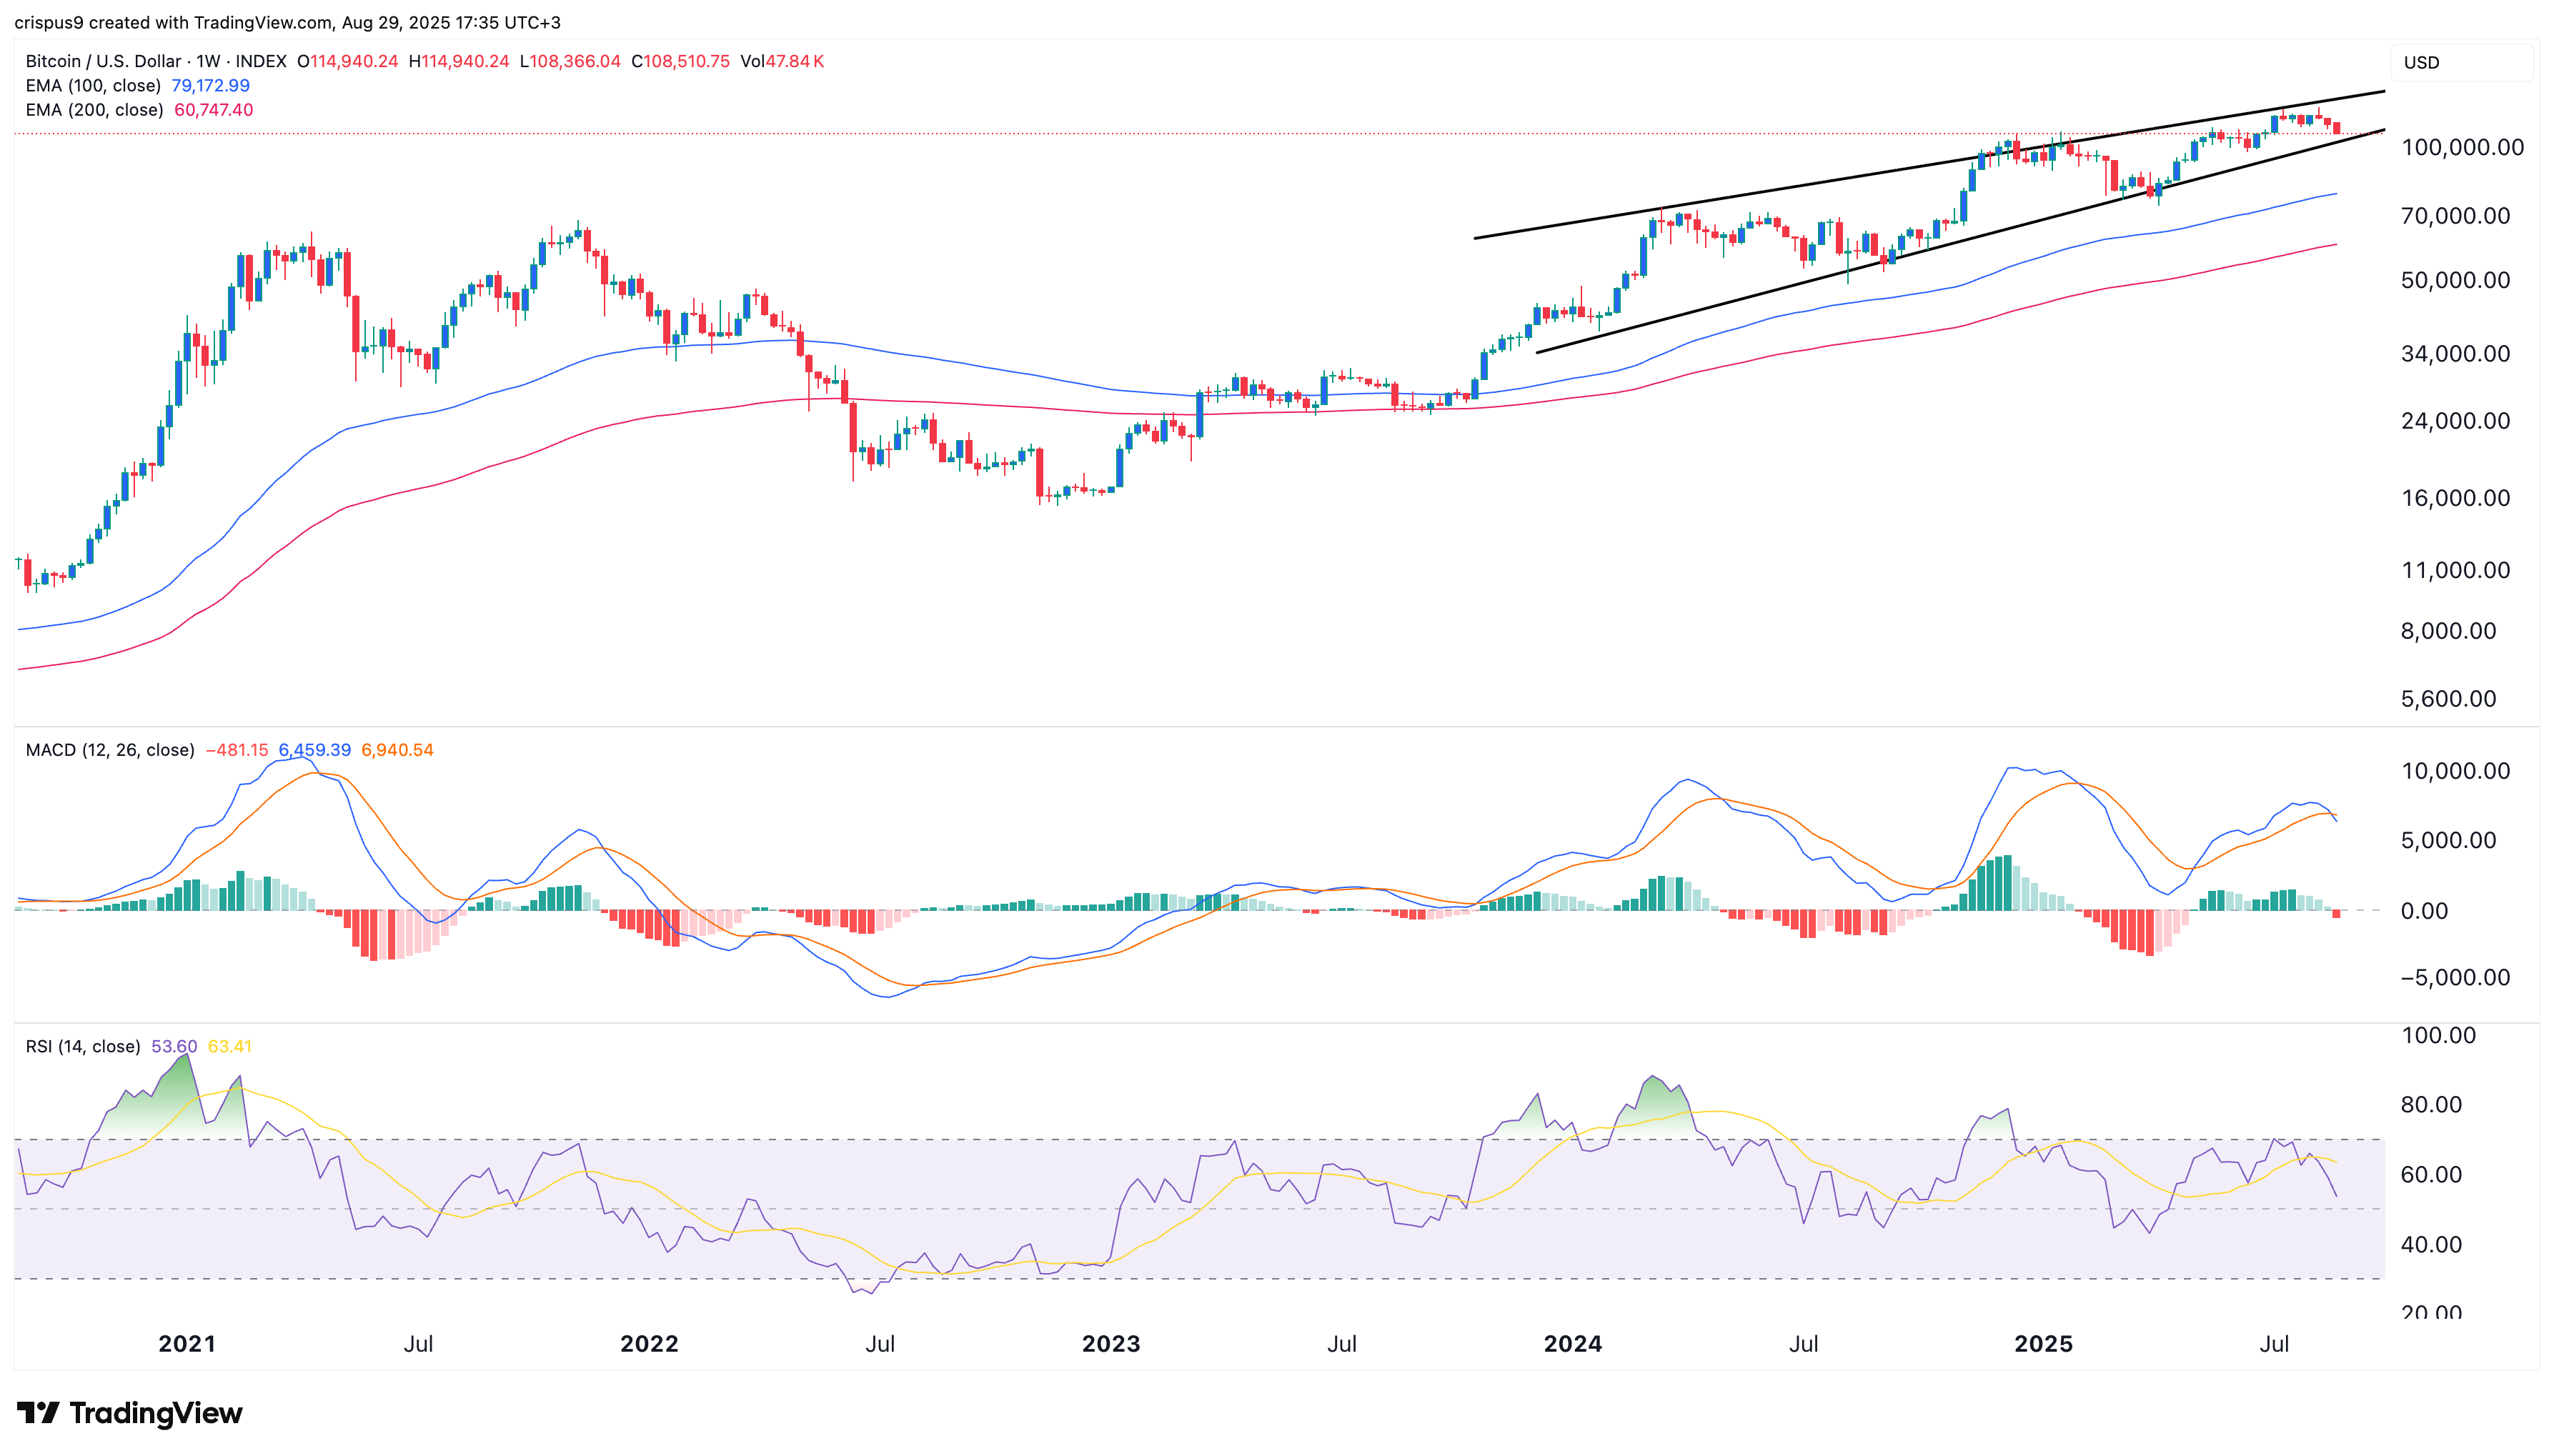
The crypto market crash continued today, Aug. 29, as liquidation doubled, the preferred Federal Reserve inflation gauge remained sticky, and Bitcoin formed a risk pattern.
Summary
- The crypto market crash gained momentum as liquidations jumped.
- US data showed that inflation remained sticky in July.
- Bitcoin price has formed a risky falling wedge chart pattern.
Bitcoin (BTC) crashed below the important support level at $110,000 for the first time in weeks, while the market capitalization of all cryptocurrencies fell to $3.78 trillion.
Crypto market crash triggered by surging liquidation
One of the main reasons why Bitcoin and altcoins are falling today is that liquidations surged by 102% in the last 24 hours to $529 million, while open interest remained above $200 billion.
Bullish Ethereum (ETH) liquidation jumped to $190 million, while Bitcoin and Solana (SOL) rose to over $40 million in this period. Liquidations happen when crypto exchanges like Binance and OKX are forced to close loss-making leveraged trades to protect their capital.
The forceful closure of cryptocurrencies and the manual profit-taking among traders often lead to more selling pressure, dragging prices.
Bitcoin and altcoins are falling as inflation remains elevated
Meanwhile, macro data released today shows that US inflation remained stubbornly high in July. The closely-watched core personal consumption expenditure data rose 0.3% in July, while the headline figure rose 0.2%.
This increase translated to an annual increase of 2.9% and 2.6%, respectively. These numbers are higher than the Federal Reserve’s target of 2.0%.
Still, the Fed will likely go on with a hawkish interest rate cut in the September interest rate decision, as it is now focused on the labor market.
These inflation numbers also explain why the top US indices like the S&P 500 and Nasdaq 100 Indices retreated.
Bitcoin price risky pattern explains the crypto crash

Additionally, there is a lingering risk that Bitcoin could be on the verge of moving into a bear market. These fears are based on the formation of a falling wedge and a bearish reversal pattern on the weekly chart.
A rising wedge pattern occurs when an asset forms two converging trendlines that are ascending. In Bitcoin’s case, these trendlines have been forming for months and are now nearing their confluence.
The MACD and the Relative Strength Index have continued falling even as Bitcoin has rallied in the past few months. Therefore, Bitcoin is at risk of falling further, which will drag other altcoins.

Source link

