


Hedera price is close to confirming a death cross on the daily chart, following the launch of its first spot ETF.
Summary
- Hedera price remains down over 305 from its July high this year.
- HBAR price action could confirm a death cross by the end of today’s session.
- Over $225 million worth of HBAR has been withdrawn from exchanges in the past 48 hours.
According to data from crypto.news, Hedera (HBAR) has dropped 34% from its July high and nearly 50% from its year-to-date high. This came as the total value locked in its DeFi protocols dropped from $405 million, seen in January, to $184 million as observed on Monday, Oct. 27.
While HBAR jumped nearly 18% to hit an intraday high of $0.22 on Tuesday following the news that the first spot HBAR ETF is set to begin trading today (Oct. 29), a move that could open the door to institutional inflows and long-term growth, the token has since given up some of those gains, slipping back to around $0.19 at press time.
A closer look at the daily chart now shows that HBAR price is very close to confirming a highly bearish signal, notably, a death cross, which forms when the 50-day SMA crosses below the 200-day SMA.
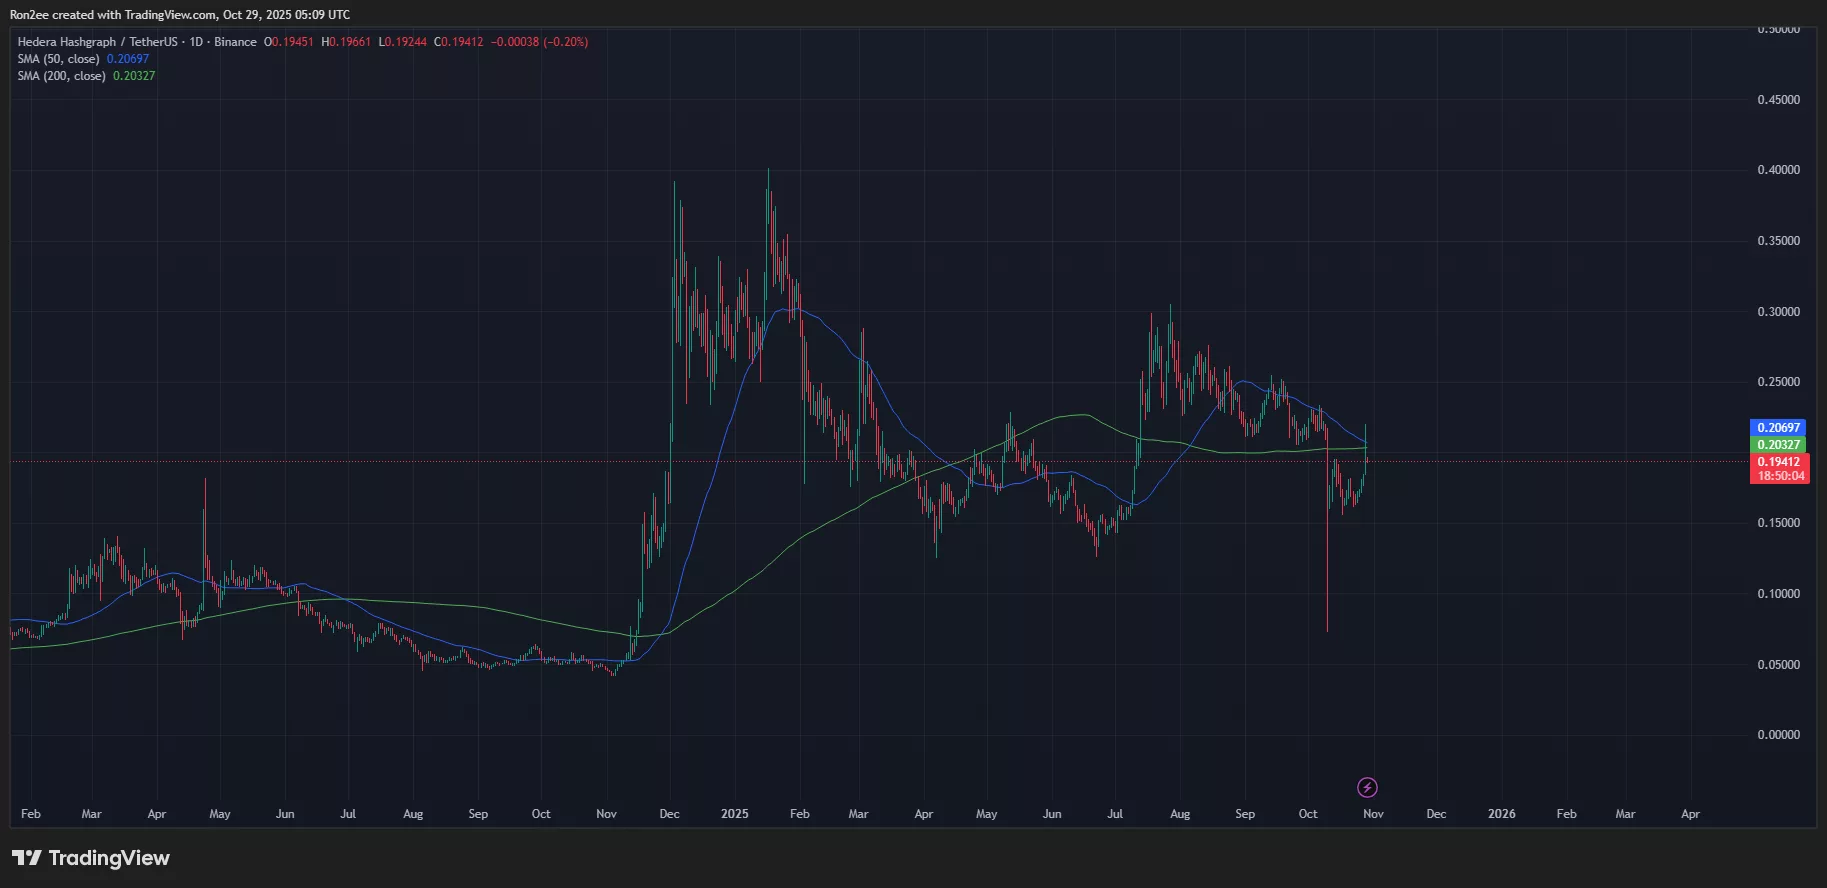
Such crosses have historically been associated with confirming an ongoing downtrend and often point to further losses ahead. For instance, when a similar death cross appeared on the HBAR chart in June 2024, the token went on to drop nearly 45% by November of that year.
While the pattern is typically viewed as a bearish continuation signal, it’s important to note that it is also a lagging indicator, meaning the worst may already be priced in. A closer look at other indicators is necessary to confirm whether this is the beginning of a deeper downtrend or simply a delayed technical reaction to past weakness.
The daily chart shows that the MACD line has crossed above the signal line, which is typically seen as a bullish sign, at least in the short term.
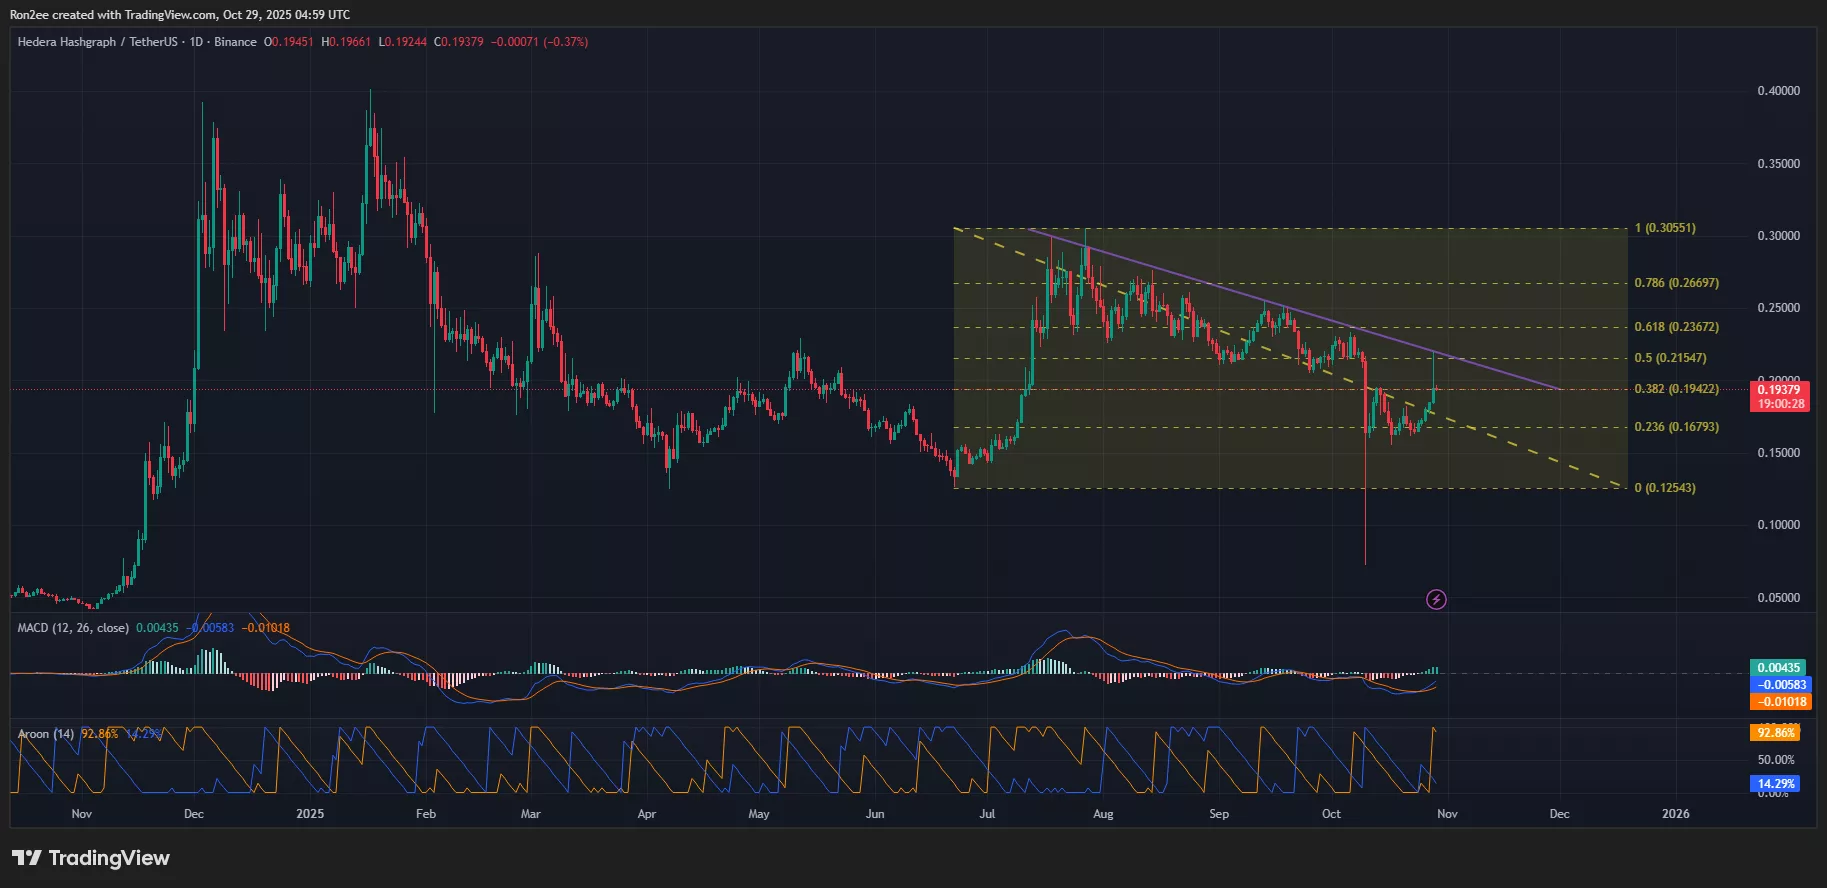
Meanwhile, the Aroon Up sits at 92.86%, while Aroon Down lags at 14.29%, further reinforcing the idea that upward trend strength is gaining ground, even as the broader outlook remains cautious.
Adding to that, HBAR also appears to be approaching a descending trendline resistance that has kept price action capped for several weeks. A decisive breakout above this trendline, particularly if paired with volume, could shift the momentum and invalidate the death cross.
Based on the current technical outlook, the hype surrounding the spot HBAR ETF launch seems to have largely undercut any negative sentiment driven by the death cross. This trend is visible when gauging exchange outflows on CoinGlass data, which shows over $225 million worth of HBAR has left exchanges since the ETF launch was announced.
For now, Hedera price is likely to face resistance around $0.21, which also aligns with the 50% Fibonacci retracement level drawn from its recent swing high. If the bulls fail to clear this hurdle, the price could remain range-bound.
On the downside, a clean break below the $0.167 support would likely confirm the continuation of the bearish trend and could open the door to deeper losses in the short term.
Disclosure: This article does not represent investment advice. The content and materials featured on this page are for educational purposes only.
Source link