


Shiba Inu price remained under pressure as the crypto market pulled back despite having some important fundamentals, such as the rising burn rate and falling exchange balances.
Summary
- Shiba Inu price is hovering above a key support level on the daily chart.
- The token’s burn rate has jumped by almost 2,000% in the last 24 hours.
- The supply of SHIB tokens on exchanges has been in a freefall in the past few weeks.
Shiba Inu (SHIB), the biggest meme coin on Ethereum (ETH), was trading at $0.0000090, a few points above the crucial support at $0.00000853. It remains 65% below its highest point this year.
SHIB has numerous bullish fundamentals. Data compiled by Shiburn shows that the burn rate jumped by nearly 2,000% on Saturday to 4.14 million. This burn was driven by one transaction of 2.14 million tokens by one user and another $1.97 million by another user.
Shiba Inu’s burn rate has been rising recently, with some users making some big incinerations. For example, one user burned 180 million tokens on Wednesday and another one 621 million a day earlier.
Token burns are often viewed positively by crypto investors because they reduce a network’s inflation. They are often compared with share buybacks, which reduce the amount of stocks in circulation.
The key difference is that share buybacks lead to a higher earnings per share, while token burns only reduce the inflation rate.
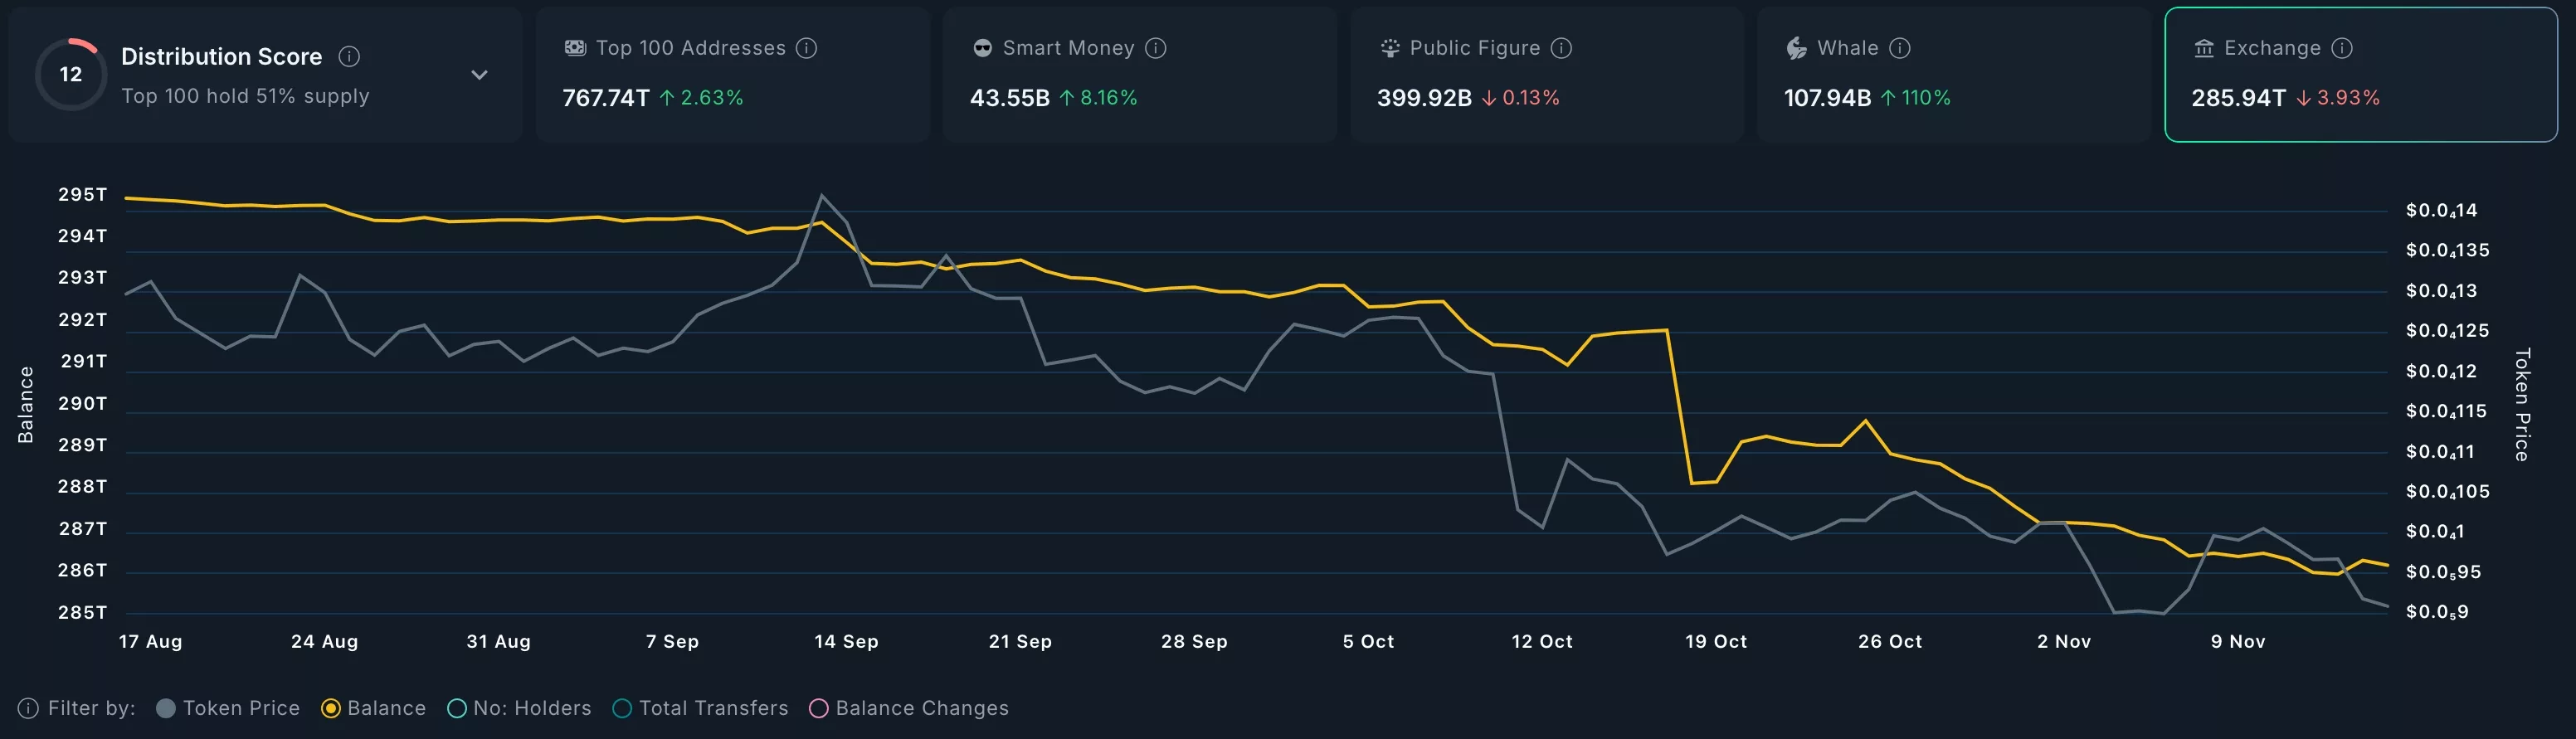
Shiba Inu may also benefit from the on-chain metrics showing that more tokens are leaving exchanges. There are now 285 million tokens in exchanges, down from 295 million in August. This is a sign that investors are not dumping the token during the ongoing plunge.
The other key catalyst for SHIB is that Shibarium has started to improve after the recent ShibaSwap exploit. Data shows that the network’s total value locked has jumped by 124% in the last 30 days to over $1.8 million.
Shiba Inu price technical analysis
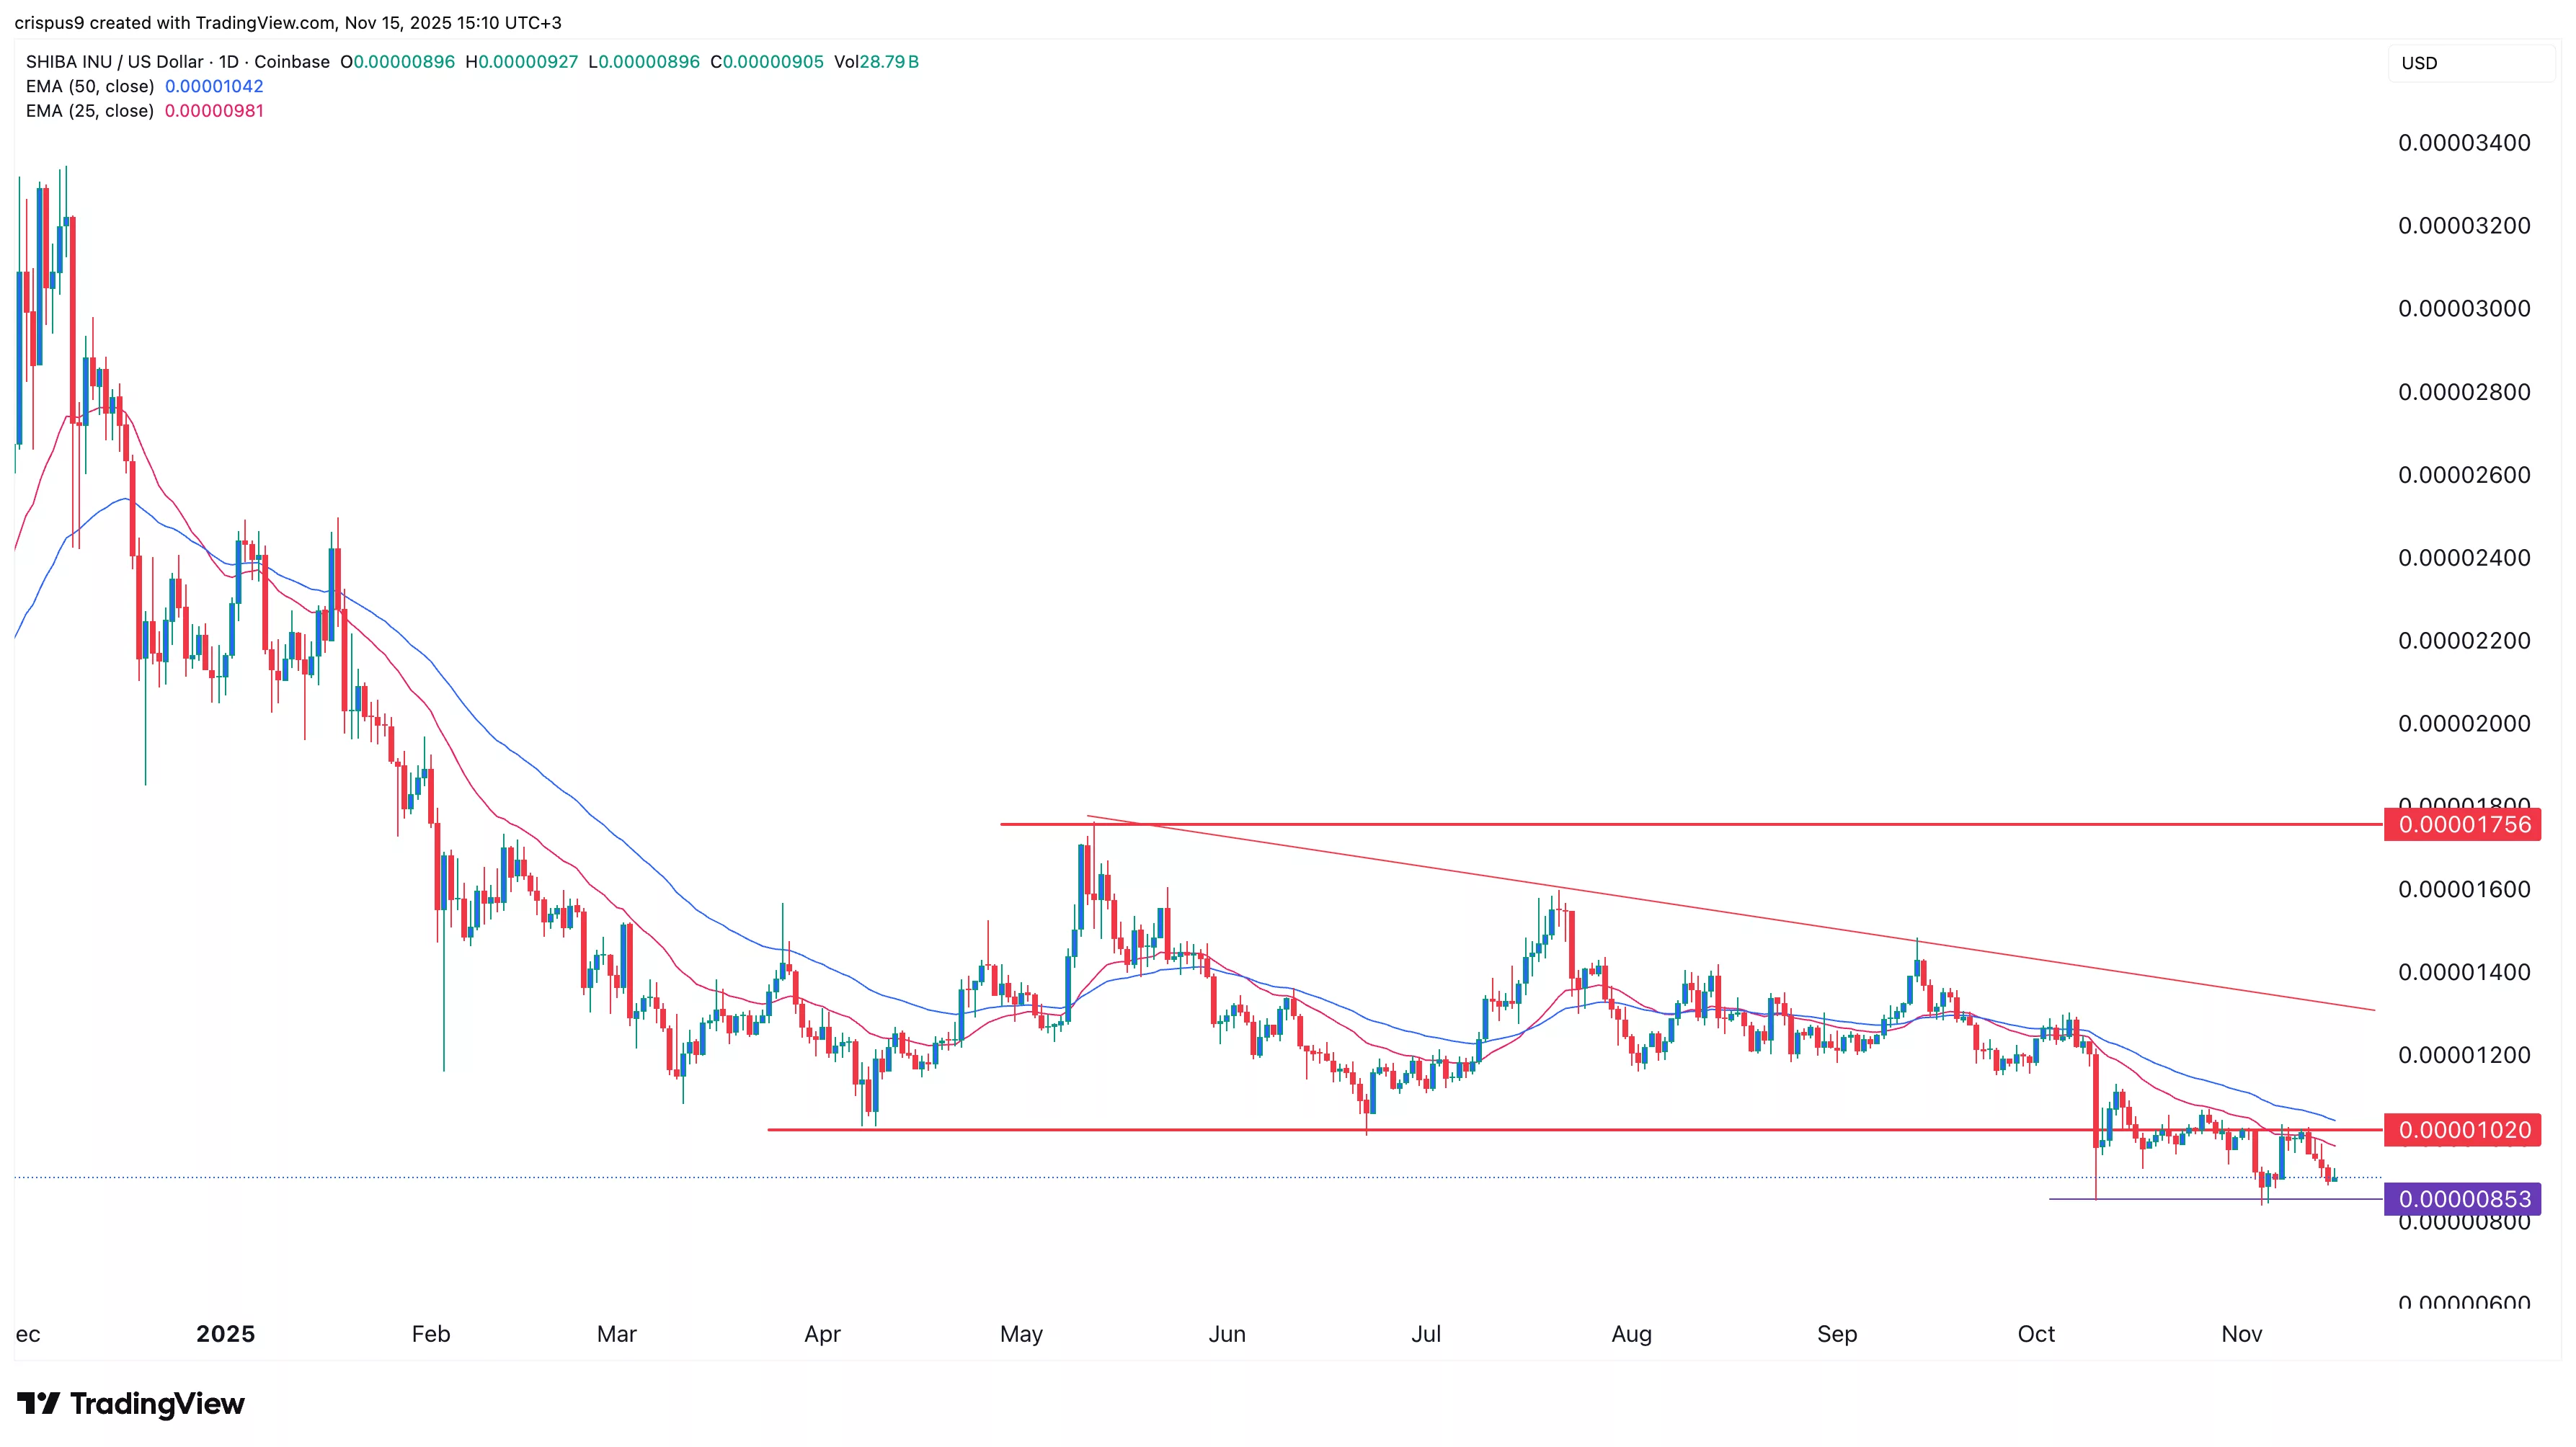
The daily timeframe chart shows that the SHIB price has slipped from $0.00001756 in May to $0.0000090 today. It formed a descending triangle pattern whose lower side is at $0.00001020.
The coin has remained below the 50-day and 25-day Exponential Moving Averages. It also moved below the key point at $0.00001020, the lower side of the descending triangle.
On the positive side, the coin has remained above the key support at $0.0000085, its lowest levels in October and this month.
Therefore, the most likely outlook is where SHIB price continues falling, potentially to $0.0000050. This view will be confirmed if it drops below the support at $0.0000085. On the flip side, moving above the key resistance at $0.000010 will invalidate the bearish outlook.
Source link