


XRP price remained in a technical bear market today, Nov. 26, after plunging by about 40% below its highest point this year.
Summary
- XRP price has plunged by ~40% from its highest point this year.
- The 30-day RLUSD volume has jumped by 56% to $3.5 billion.
- XRP ETF inflows have jumped to $622 million.
Ripple (XRP) token was trading at $2.15, up modestly from this month’s low of $1.8173.
XRP has key stablecoin and ETF tailwinds
The XRP price has remained under pressure in the past few months despite some notable bullish catalysts. One of these catalysts is the ongoing growth of Ripple USD (RLUSD), its stablecoin.
Artemis data shows that its top metrics are doing well. For example, the amount of RLUSD in circulation has jumped by 28% in the last 30 days to $1.2 billion. This makes it the third-biggest GENIUS Act-compliant stablecoin after USDC and PayPal’s PYUSD.
The number of RLUSD stablecoin transactions rose by some 17% in the last 30 days to 443,000. Also, the adjusted transaction volume spiked by about 56% to $3.5 billion, a sign that people are using it.
While most of the RLUSD supply is on the Ethereum (ETH) network, the one in the XRP Ledger is seeing robust growth. It has jumped to almost $300 million in the past few months, a trend that may continue.
Meanwhile, American investors are accelerating their purchases of XRP ETFs. SoSoValue data shows that these funds have not experienced a single day of outflows. Their cumulative inflows have jumped to over $622 million, while net assets are $644 million.
XRP ETF assets account for about 0.50% of its market cap, suggesting they have more room to grow. For one, Ethereum funds account for 5.5% of its market cap, while Bitcoin (BTC) funds account for 6.54%.
XRP price technical analysis suggests more pain
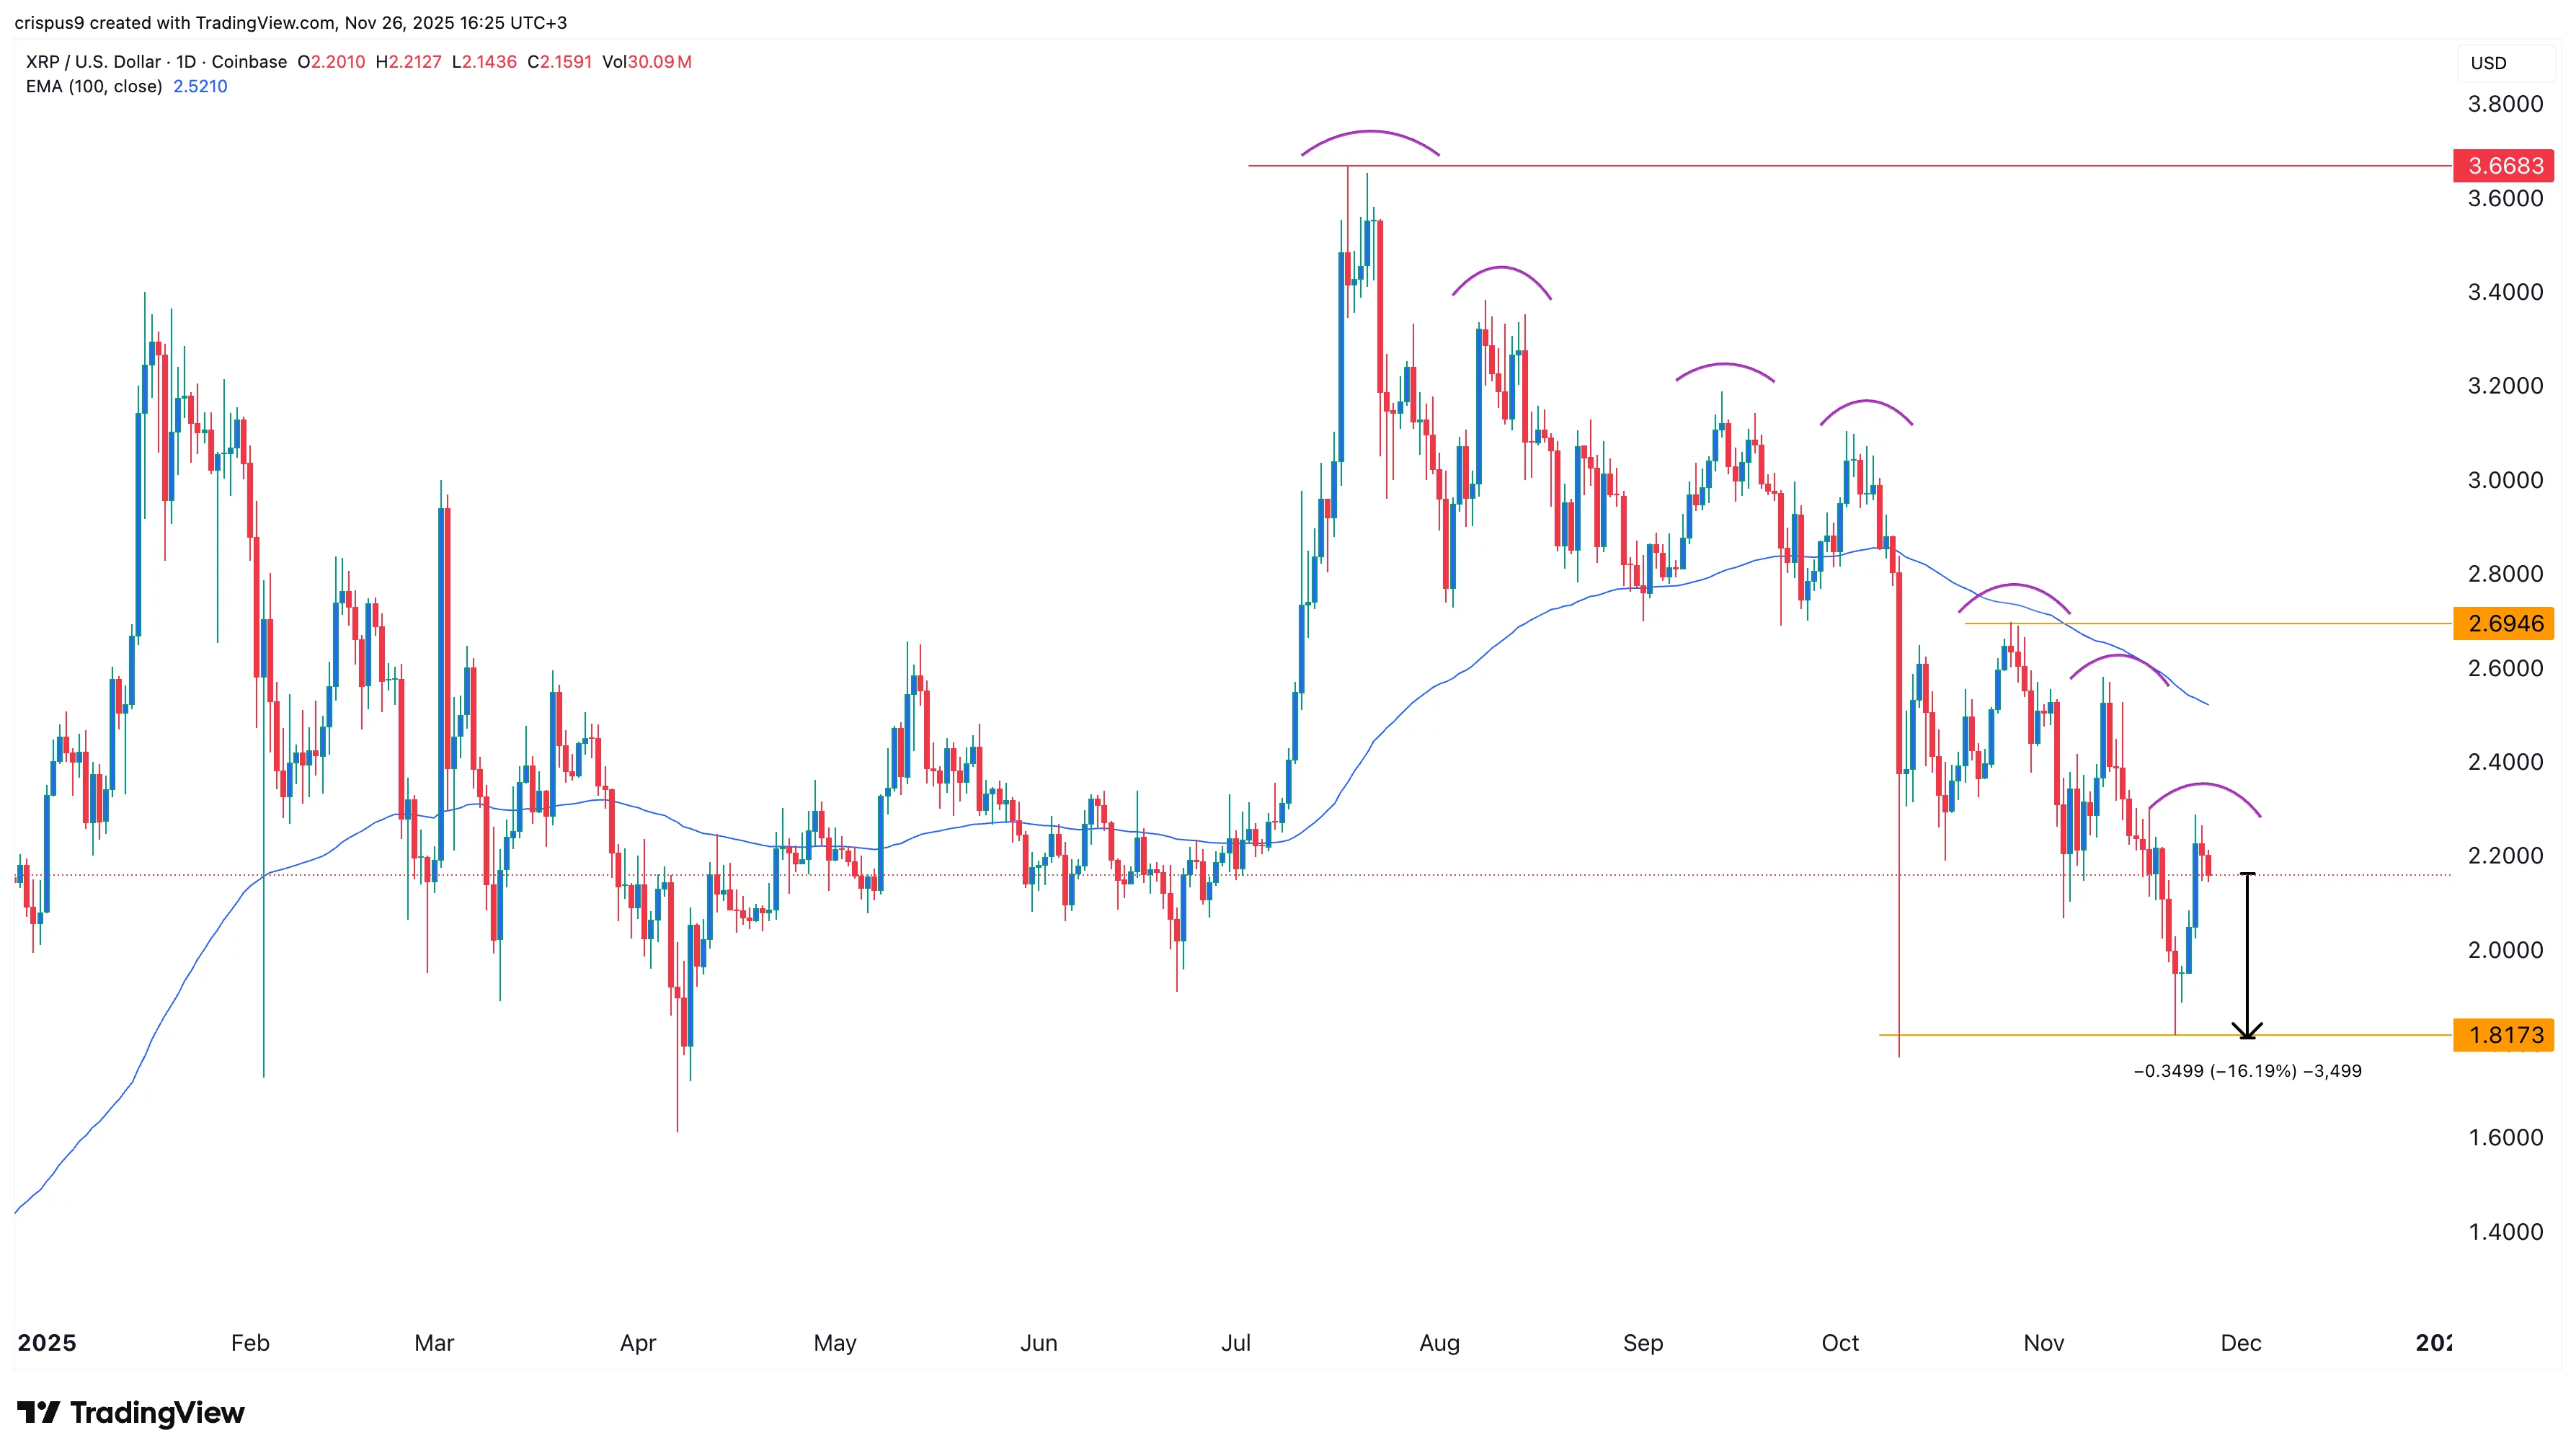
While Ripple price has bullish fundamentals, its technicals tell a different story. For one, the token has constantly remained below the 100-day Exponential Moving Average. It has also crashed below the Supertrend indicator.
Most importantly, a closer look at this chart suggests that it has been forming a series of lower lows and lower highs. This explains why its recent attempt to rebound has floundered.
Therefore, the most likely XRP price forecast is bearish, with the initial target being at $1.8173, the lowest level this month and in October. This target is roughly 16% below the current level.
Source link