


XRP price has confirmed a descending triangle on the daily chart. At the same time, whales have been offloading their holdings, adding to the bearish pressure.
Summary
- XRP price is down 12% over the past week.
- A bearish macro environment and whale selloffs have weighed on investor sentiment.
- The token risks a 25% drop after confirming a bearish descending triangle
According to data from crypto.news, XRP (XRP) price was trading at $2.52, down 12% over the past 7 days and over 30% from its all-time high this year.
One of the main reasons for the downturn this week is the broader risk-off sentiment spreading among investors, driven by concerns over the fresh round of U.S. tariffs on Chinese goods.
With talks between the two economic giants still failing to reach a resolution before the looming Nov. 1 deadline, fear continues to grip the market, as reflected by the current readings of the Crypto Fear and Greed Index.
Another factor that added to investor caution was the uncertainty ahead of Federal Reserve Chair Jerome Powell’s speech yesterday. Many were likely waiting for cues on whether the Fed would signal any potential rate cuts or changes in its policy stance.
At the same time, investor sentiment has also been dampened by ongoing delays around the approval of spot XRP ETFs in the U.S.
Whales seem to be reacting to these bearish pressures, as on-chain data indicates these deep-pocketed entities have offloaded at least 2.23 billion XRP since the U.S. announced its latest round of tariffs on Friday.
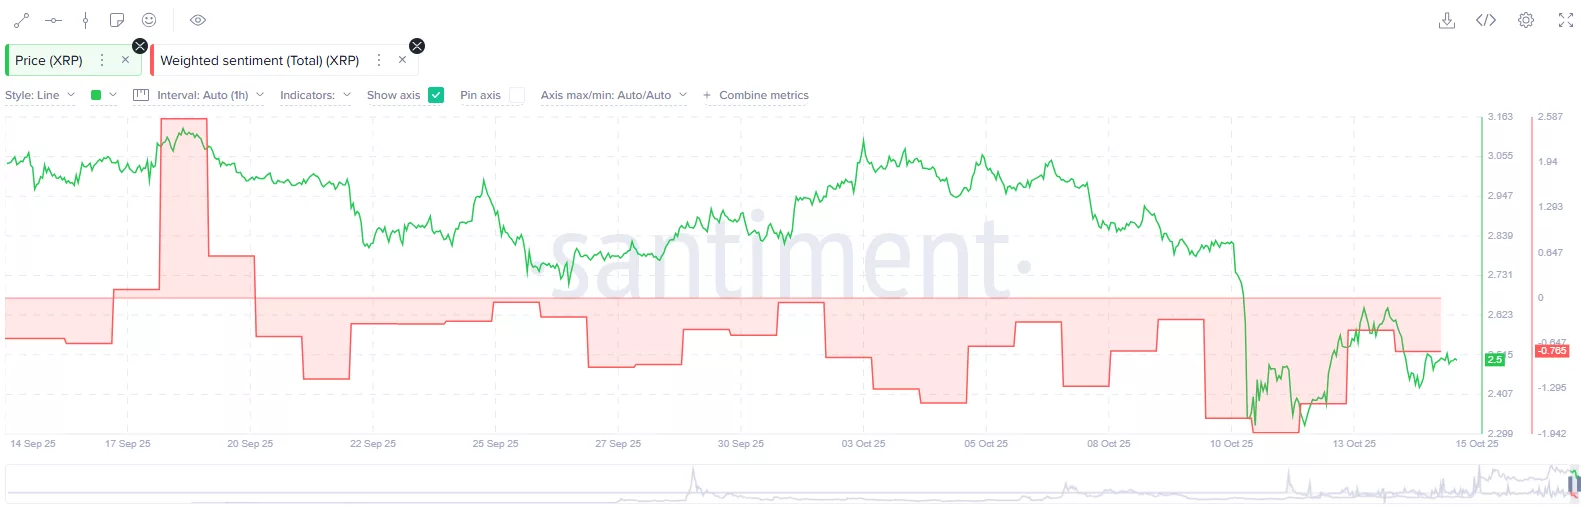
According to data from Santiment, XRP’s social sentiment, which gauges investor outlook regarding the token, has been negative since late September, reinforcing the broader market pessimism that appears to be influencing whale behavior.
Such heightened selling activity from whales often leads to panic among retail investors who tend to track large holders closely, and this could continue to drag the token’s price lower.
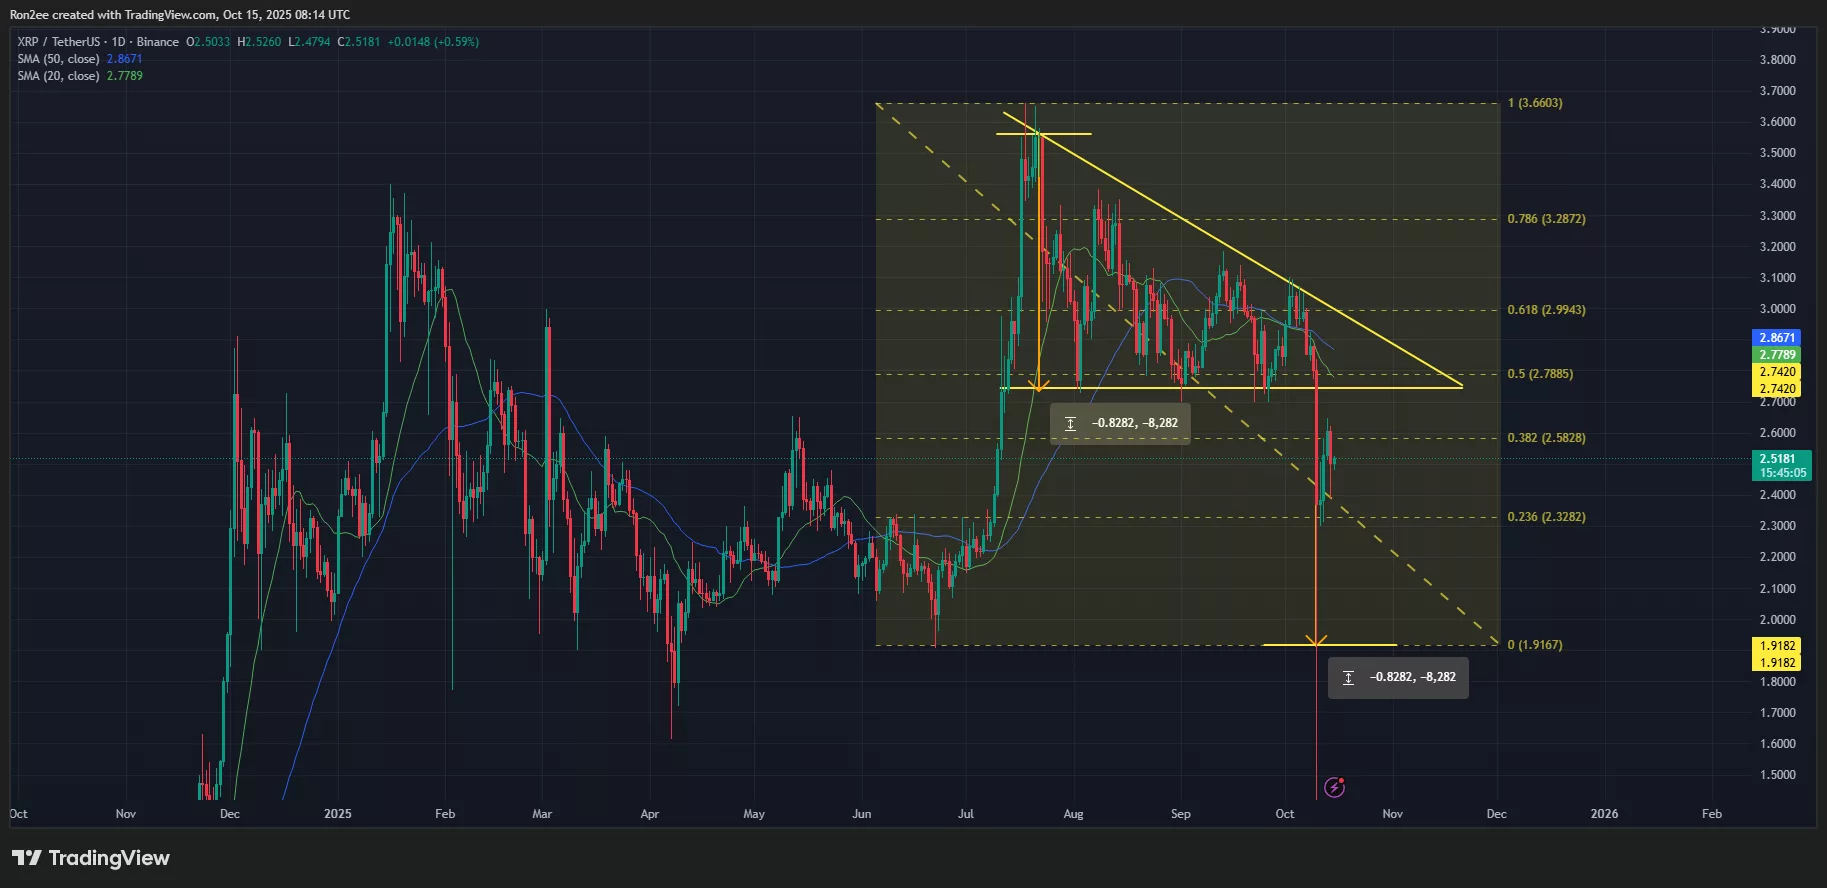
On the daily chart, XRP price has confirmed a breakdown from a descending triangle pattern, a bearish formation characterized by a series of lower highs converging toward a horizontal support level, often indicating sellers have strong control over the market.
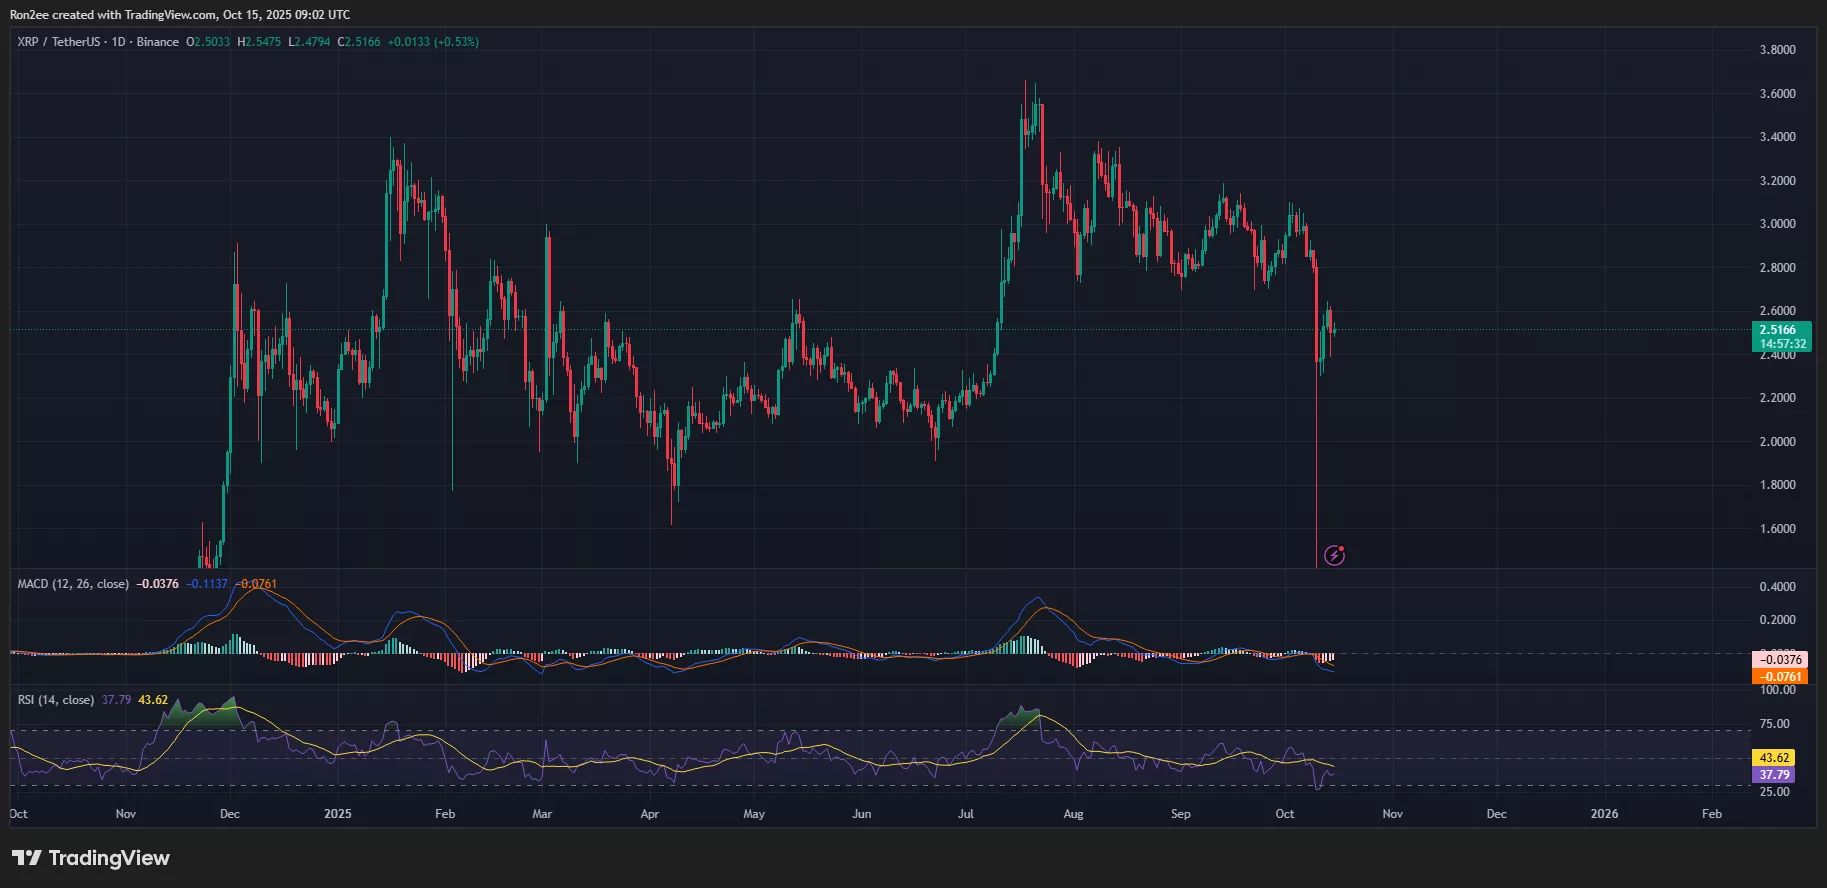
Adding to the bearish outlook, the 20-day simple moving average has now crossed below the 50-day SMA, a classic technical signal that often precedes further downside momentum.
Momentum indicators are also flashing warning signs. Both the MACD and RSI lines are sloping downward, adding another layer of confirmation to the bearish setup.
For now, the closest key support sits at $2.32, which aligns with the 23.6% Fibonacci retracement level, drawn from the swing low on June 22 to the peak on July 18. A clean break below this level would likely accelerate losses, with the next downside target near $1.90, a figure derived by subtracting the triangle’s height from the breakdown point.
The $1.90 support zone has been tested multiple times this year and has served as a crucial support level where buyers have attempted to step in. It stands nearly 25% below the current price.
On the flip side, the closest resistance sits at $2.74. A decisive breakout above that level could signal the end of the current downtrend and possibly pave the way for a bullish reversal, assuming bulls reclaim control of the market.
Disclosure: This article does not represent investment advice. The content and materials featured on this page are for educational purposes only.
Source link