

XRP price moved sideways this week despite the highly successful Ripple Swell event and the growing Ripple USD stablecoin.
Summary
- XRP price remains on edge as the RLUSD volume jumps.
- RLUSD’s supply jumped to $1 billion this month.
- Technicals suggest that an XRP price rebound is possible.X
Ripple (XRP) token was trading at $2.3200, down by double digits from its highest level this year. This price action was eerily similar to that of other top coins like Bitcoin and Solana.
RLUSD transaction volume is rising
The XRP price wavered as the Ripple USD (RLUSD) stablecoin continued growing. Data compiled by Artemis shows that the stablecoin’s assets crossed the important $1 billion milestone less than a year after its launch.
Most importantly, the number and volume of RLUSD transactions are in a strong uptrend. The adjusted volume jumped by 210% in the last 30 days to over $4 billion. This happened as the number of transactions soared by 26% to $480,000.
Ripple’s USD growth will likely accelerate following recent initiatives by Ripple Labs. For example, the company acquired Hidden Road and changed its name to Ripple Prime. Hidden Road handles billions of dollars a day, and some of these funds may be routed through RLUSD.
Ripple also acquired GTreasury, a company that also handles billions of dollars a year. Most recently, it inked a deal with Gemini, Mastercard, and WebBank to trial RLUSD in card settlement.
XRP price has other potential catalysts that may boost its performance. The most notable one is that 21Shares and Bitwise are advancing their ETF filings, with the listing expected later this month.
XRP price technical analysis
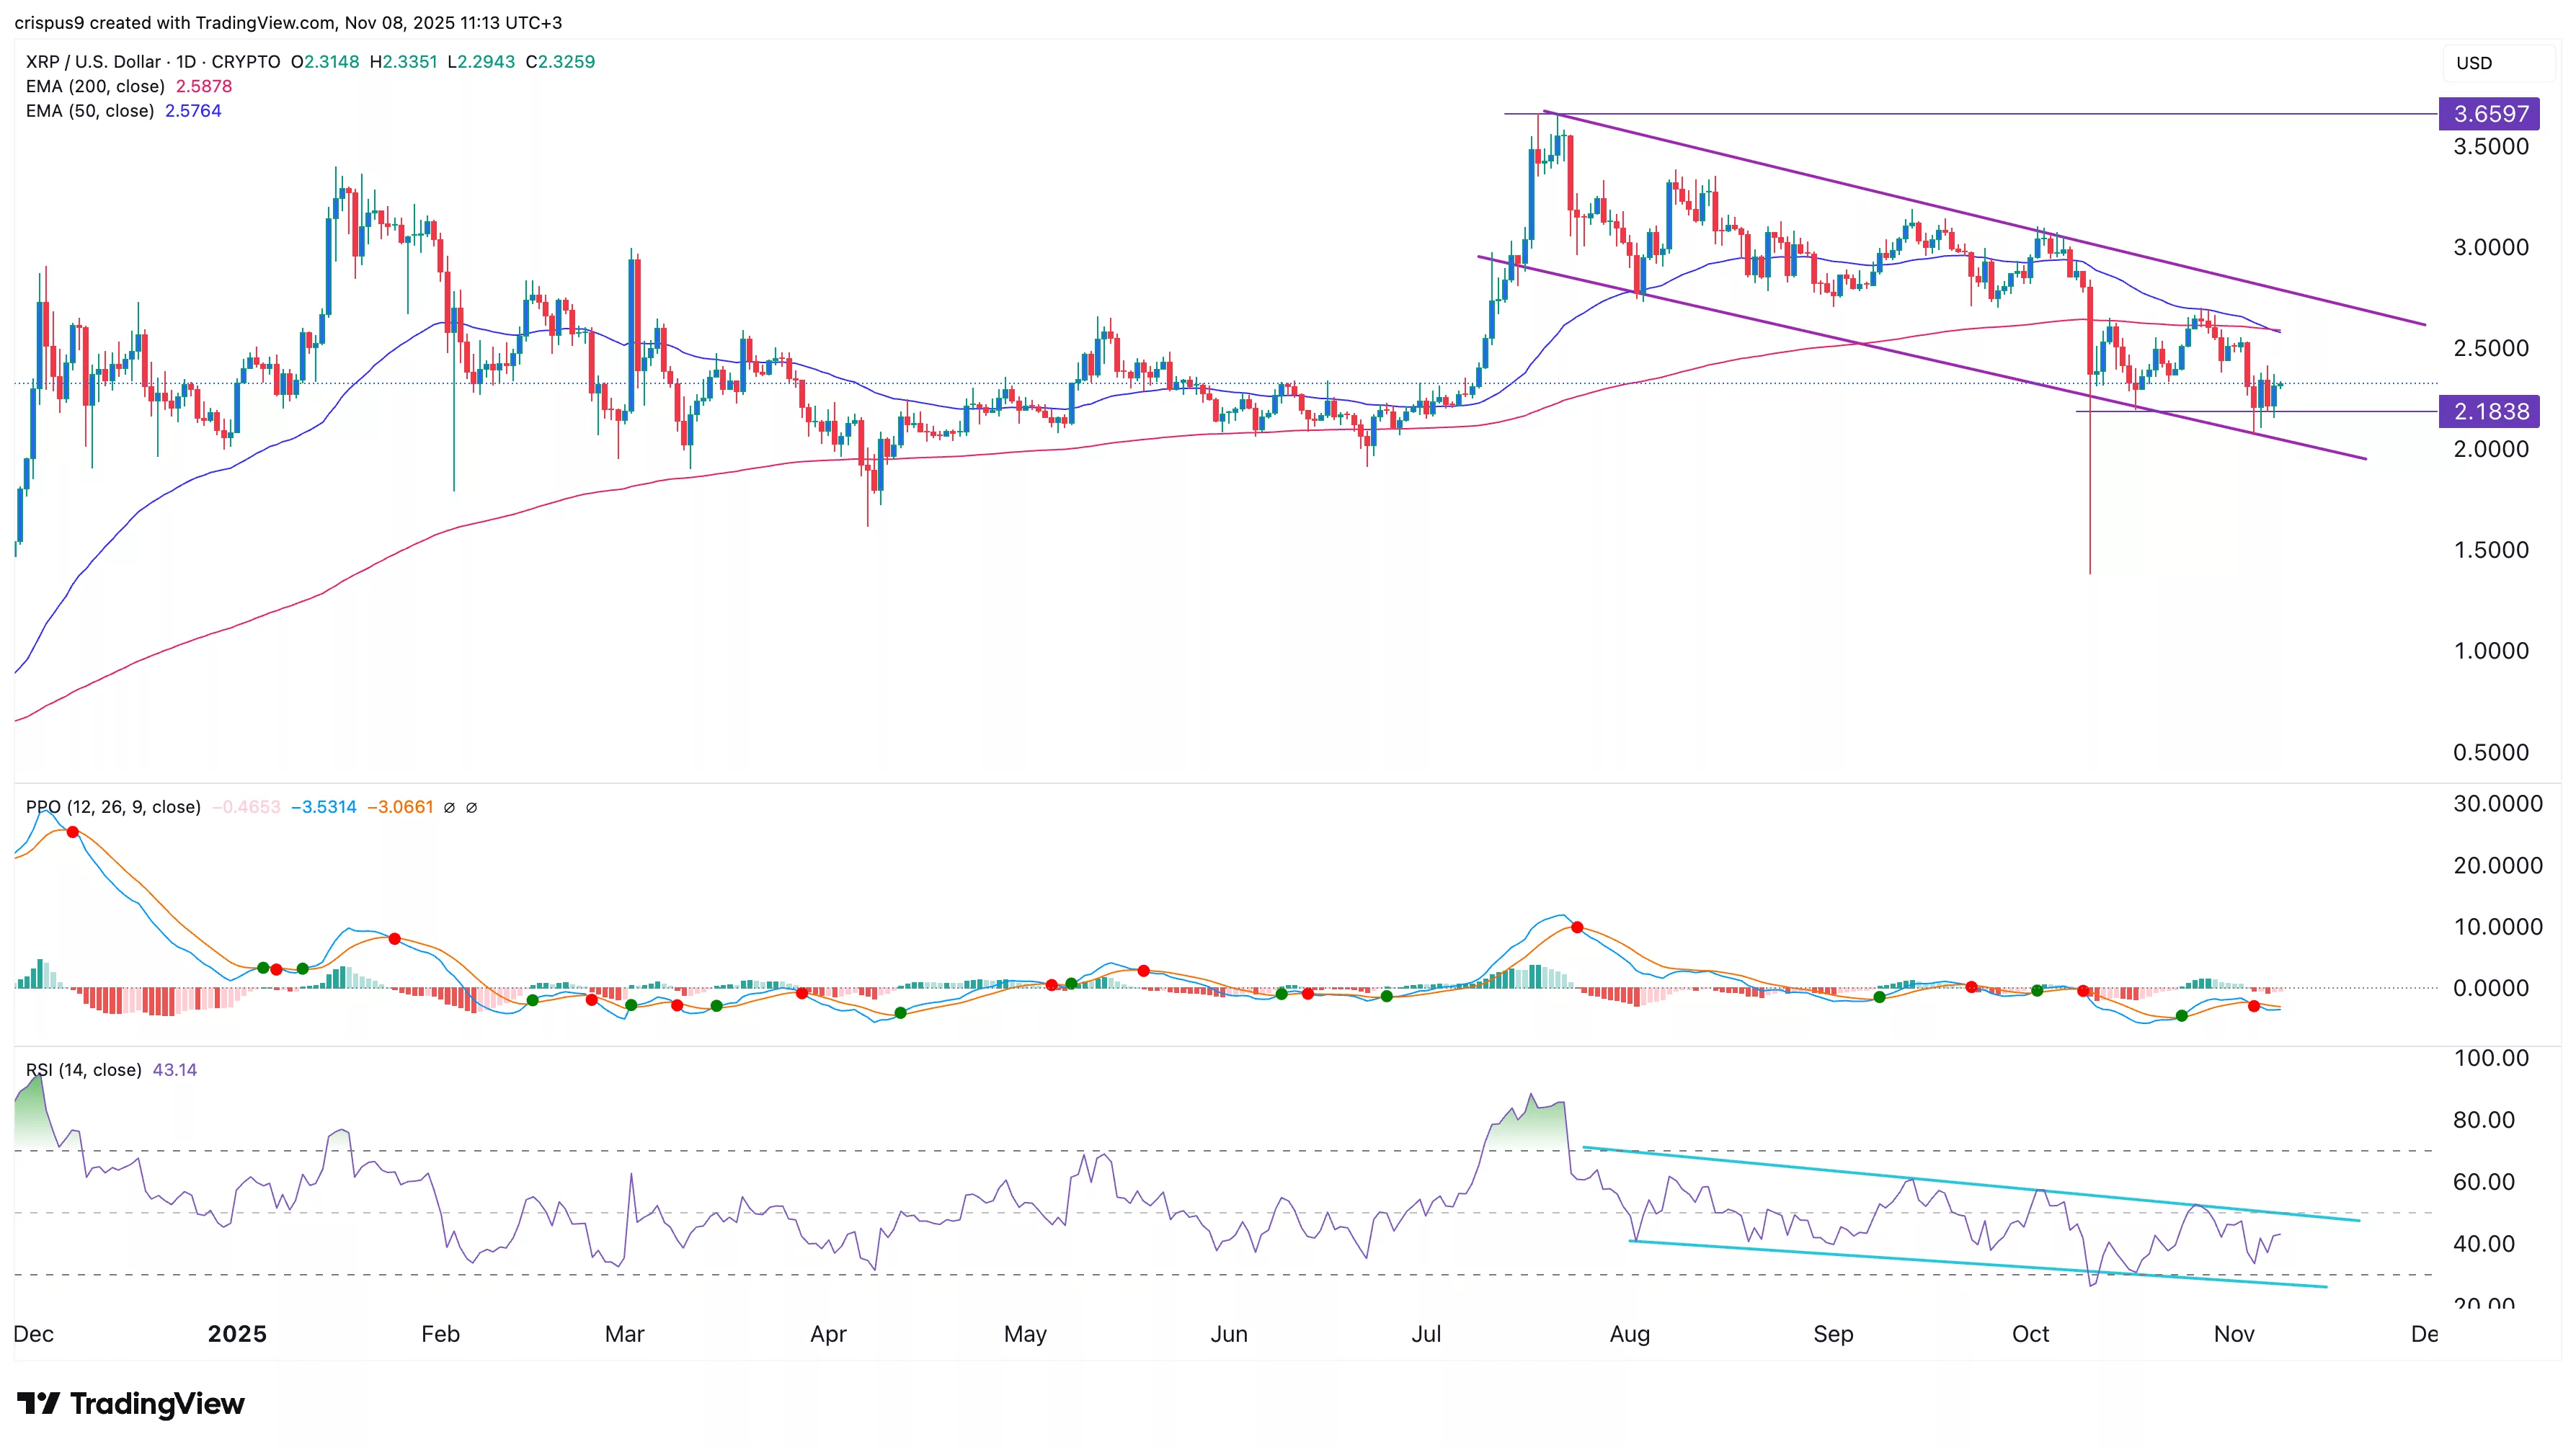
The daily timeframe chart is sending mixed signals about the XRP price. On the negative side, the coin has just formed a death cross pattern, which happens when the 50-day and 200-day moving averages cross each other. This pattern normally leads to more downside.
On the positive side, the token has formed a double-bottom pattern at $2.1838 and a neckline at $2.68. Also, the Relative Strength Index and the Percentage Price Oscillator have formed a bullish divergence pattern.
There are also signs that the token is in the second stage of the Elliot Wave. As such, these patterns point to more upside, potentially to the resistance at $3. A move below the key support at $2.1838 will invalidate the bullish XRP price forecast.
Disclosure: This article does not represent investment advice. The content and materials featured on this page are for educational purposes only.
Source link