The Strategy stock price has moved into a technical correction after falling 14% from its highest point this month.
MSTR dropped to $370, well below this month’s high of $430, as Bitcoin (BTC) and other cryptocurrencies declined. It has fallen to its lowest level since April 30 and has underperformed Bitcoin, which is down just 5% from its highest point this year.
Strategy stock typically tracks Bitcoin’s performance, as the company is the largest corporate holder of the cryptocurrency globally. It acquired over 4,000 coins last week, bringing total holdings to 580,250 BTC, currently worth over $61 billion.
Strategy has committed to continuing its Bitcoin accumulation. The firm aims to raise $84 billion, primarily through convertible bonds, to fund future purchases. It also plans to hold these coins for the long term.
There are two main reasons analysts expect Strategy stock to rebound. First, sentiment around Bitcoin’s long-term price outlook remains highly bullish. Adam Back, a well-known Bitcoin analyst mentioned in the original white paper, predicted the coin could reach $1 million within five years.
BlackRock, the world’s largest asset manager, has projected Bitcoin could surge to $700,000 over time. Similarly, Cathie Wood’s Ark Invest believes it could reach $2.4 million by the end of the decade.
Michael Saylor has said that Bitcoin represents a $100 trillion opportunity and expects the price to continue rising as it has since inception.
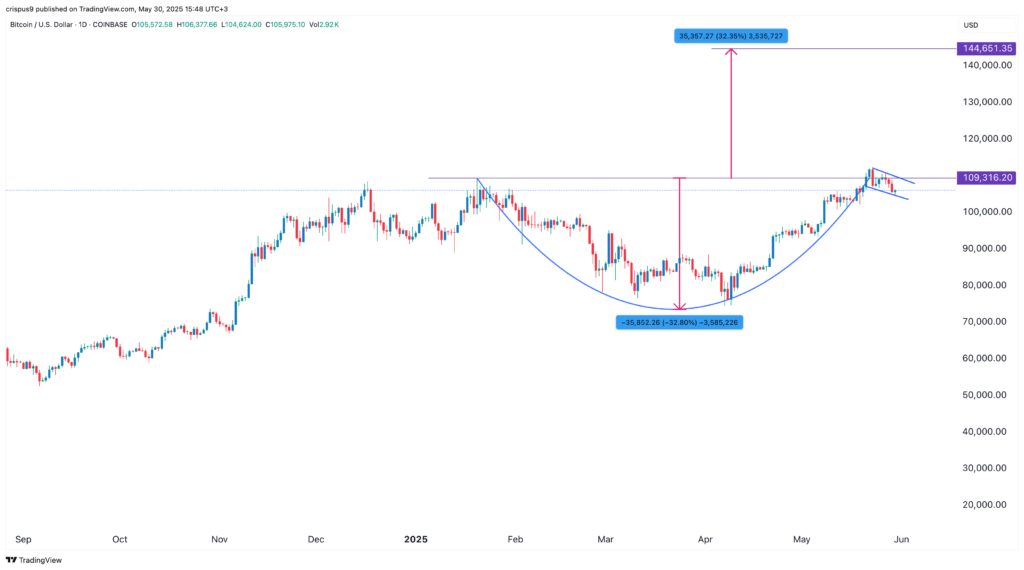
Second, Bitcoin has formed a cup-and-handle pattern on the daily chart, pointing to a potential rally toward $145,000 in the coming months. If it moves to that level, Strategy’s current holdings would be worth $84 billion.

Strategy stock has strong technicals

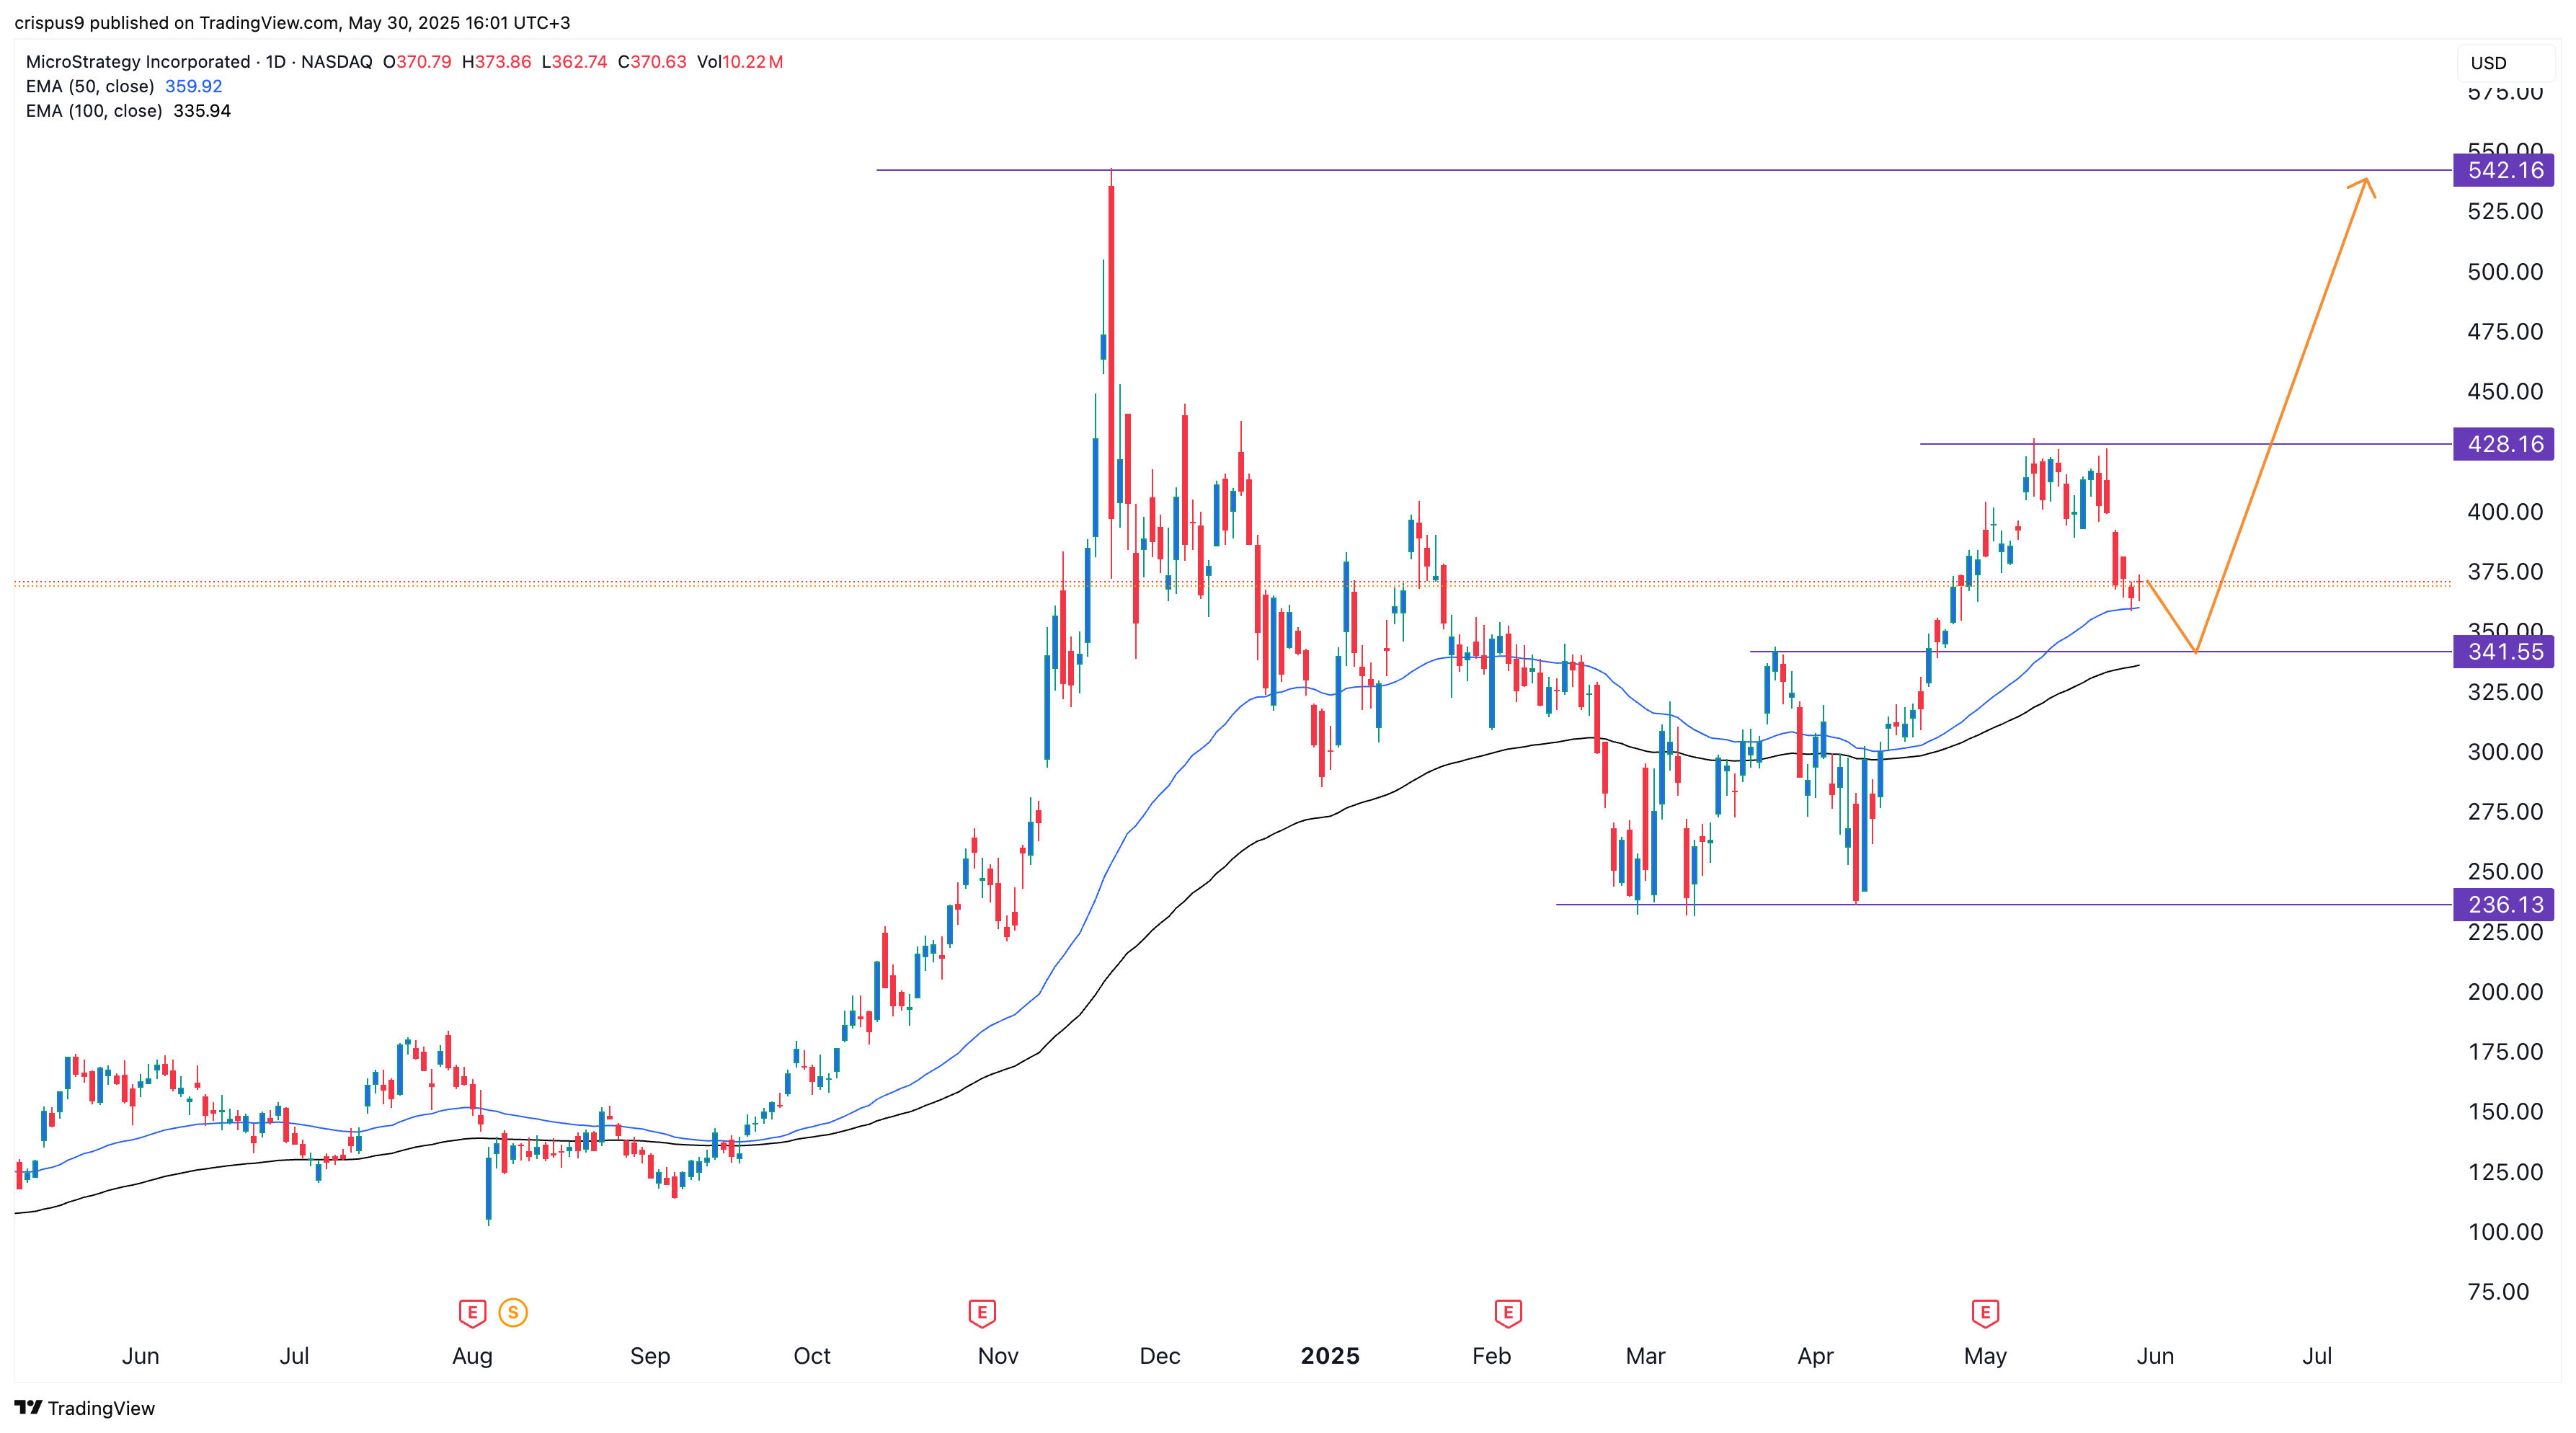
Technical analysis suggests a strong comeback for MSTR. The daily chart shows the stock formed a double-bottom pattern at $236.10 between March and April. It then broke above the neckline at $341.55 on April 23.
Strategy now appears to be performing a break-and-retest pattern by revisiting the neckline at $341.55. This type of retest often serves as confirmation of a continuing bullish trend.
MSTR also remains above the 50-day and 100-day Exponential Moving Averages, signaling that the broader uptrend remains intact. Therefore, the most likely scenario is a drop to $341 followed by a rebound, first to this month’s high of $428, and potentially to its all-time high of $542.

Source link

