


A crypto flash crash resumed today, Aug. 25, erasing some of the gains made during the weekend after Jerome Powell delivered a dovish statement at the Jackson Hole Symposium on Friday.
Summary
- The crypto flash crash accelerated on Monday, with the market capitalization of all coins falling to $3.86 trillion.
- This decline was a sign that the recent rally was a dead cat bounce.
- The crypto market crash also happened as liquidations jumped.
Bitcoin (BTC) price dropped to $111,400, down from the weekend high of $117,000, while Ethereum (ETH) fell to $4,640, a day after it neared the crucial resistance level at $5,000.
The market capitalization of all tokens dropped by 2.9% to $3.86 trillion, down from the year-to-date high of over $4.1 trillion.
Crypto flash crash triggered by surging liquidations
One potential reason for the ongoing crypto crash is the surging liquidations. CoinGlass data shows that liquidations surged by 390% to $845 million, resulting in the liquidation of 166,000 traders.
Ethereum bulls suffered most of the liquidations in the last 24 hours to $304 million, while Bitcoin’s surged to over $272 million. The other top liquidations were Dogecoin (DOGE), Solana (SOL), and Chainlink (LINK).
Liquidations happen when crypto exchanges are forced to close leveraged trades to prevent more losses. A substantial liquidation of bullish trades normally leads to more selling pressure.
At the same time, the derivatives market data shows that futures open interest jumped by 11.74% to over $1 trillion, while the weighted funding rate rose by 17%, triggering a long squeeze.
The crypto flash crash is also occurring due to profit-taking following the recent surge.
Potential dead-cat bounce
The other potential reason why the crypto market crash is happening is that the recent surge was a dead-cat bounce or DCB. A DCB is a situation where a dropping asset stages a brief rally, commonly known as a bullish trap, and then resumes the downtrend.
The probability that this could be a dead-cat bounce is high because, as shown below, Bitcoin has formed numerous bearish chart patterns.
The weekly chart shows that it has formed the highly bearish rising wedge pattern. This pattern’s upper side connects the highest levels since March last year, while the lower one connects the lowest points since August last year. Odds of a bearish breakout have jumped as the two lines have neared their confluence level.
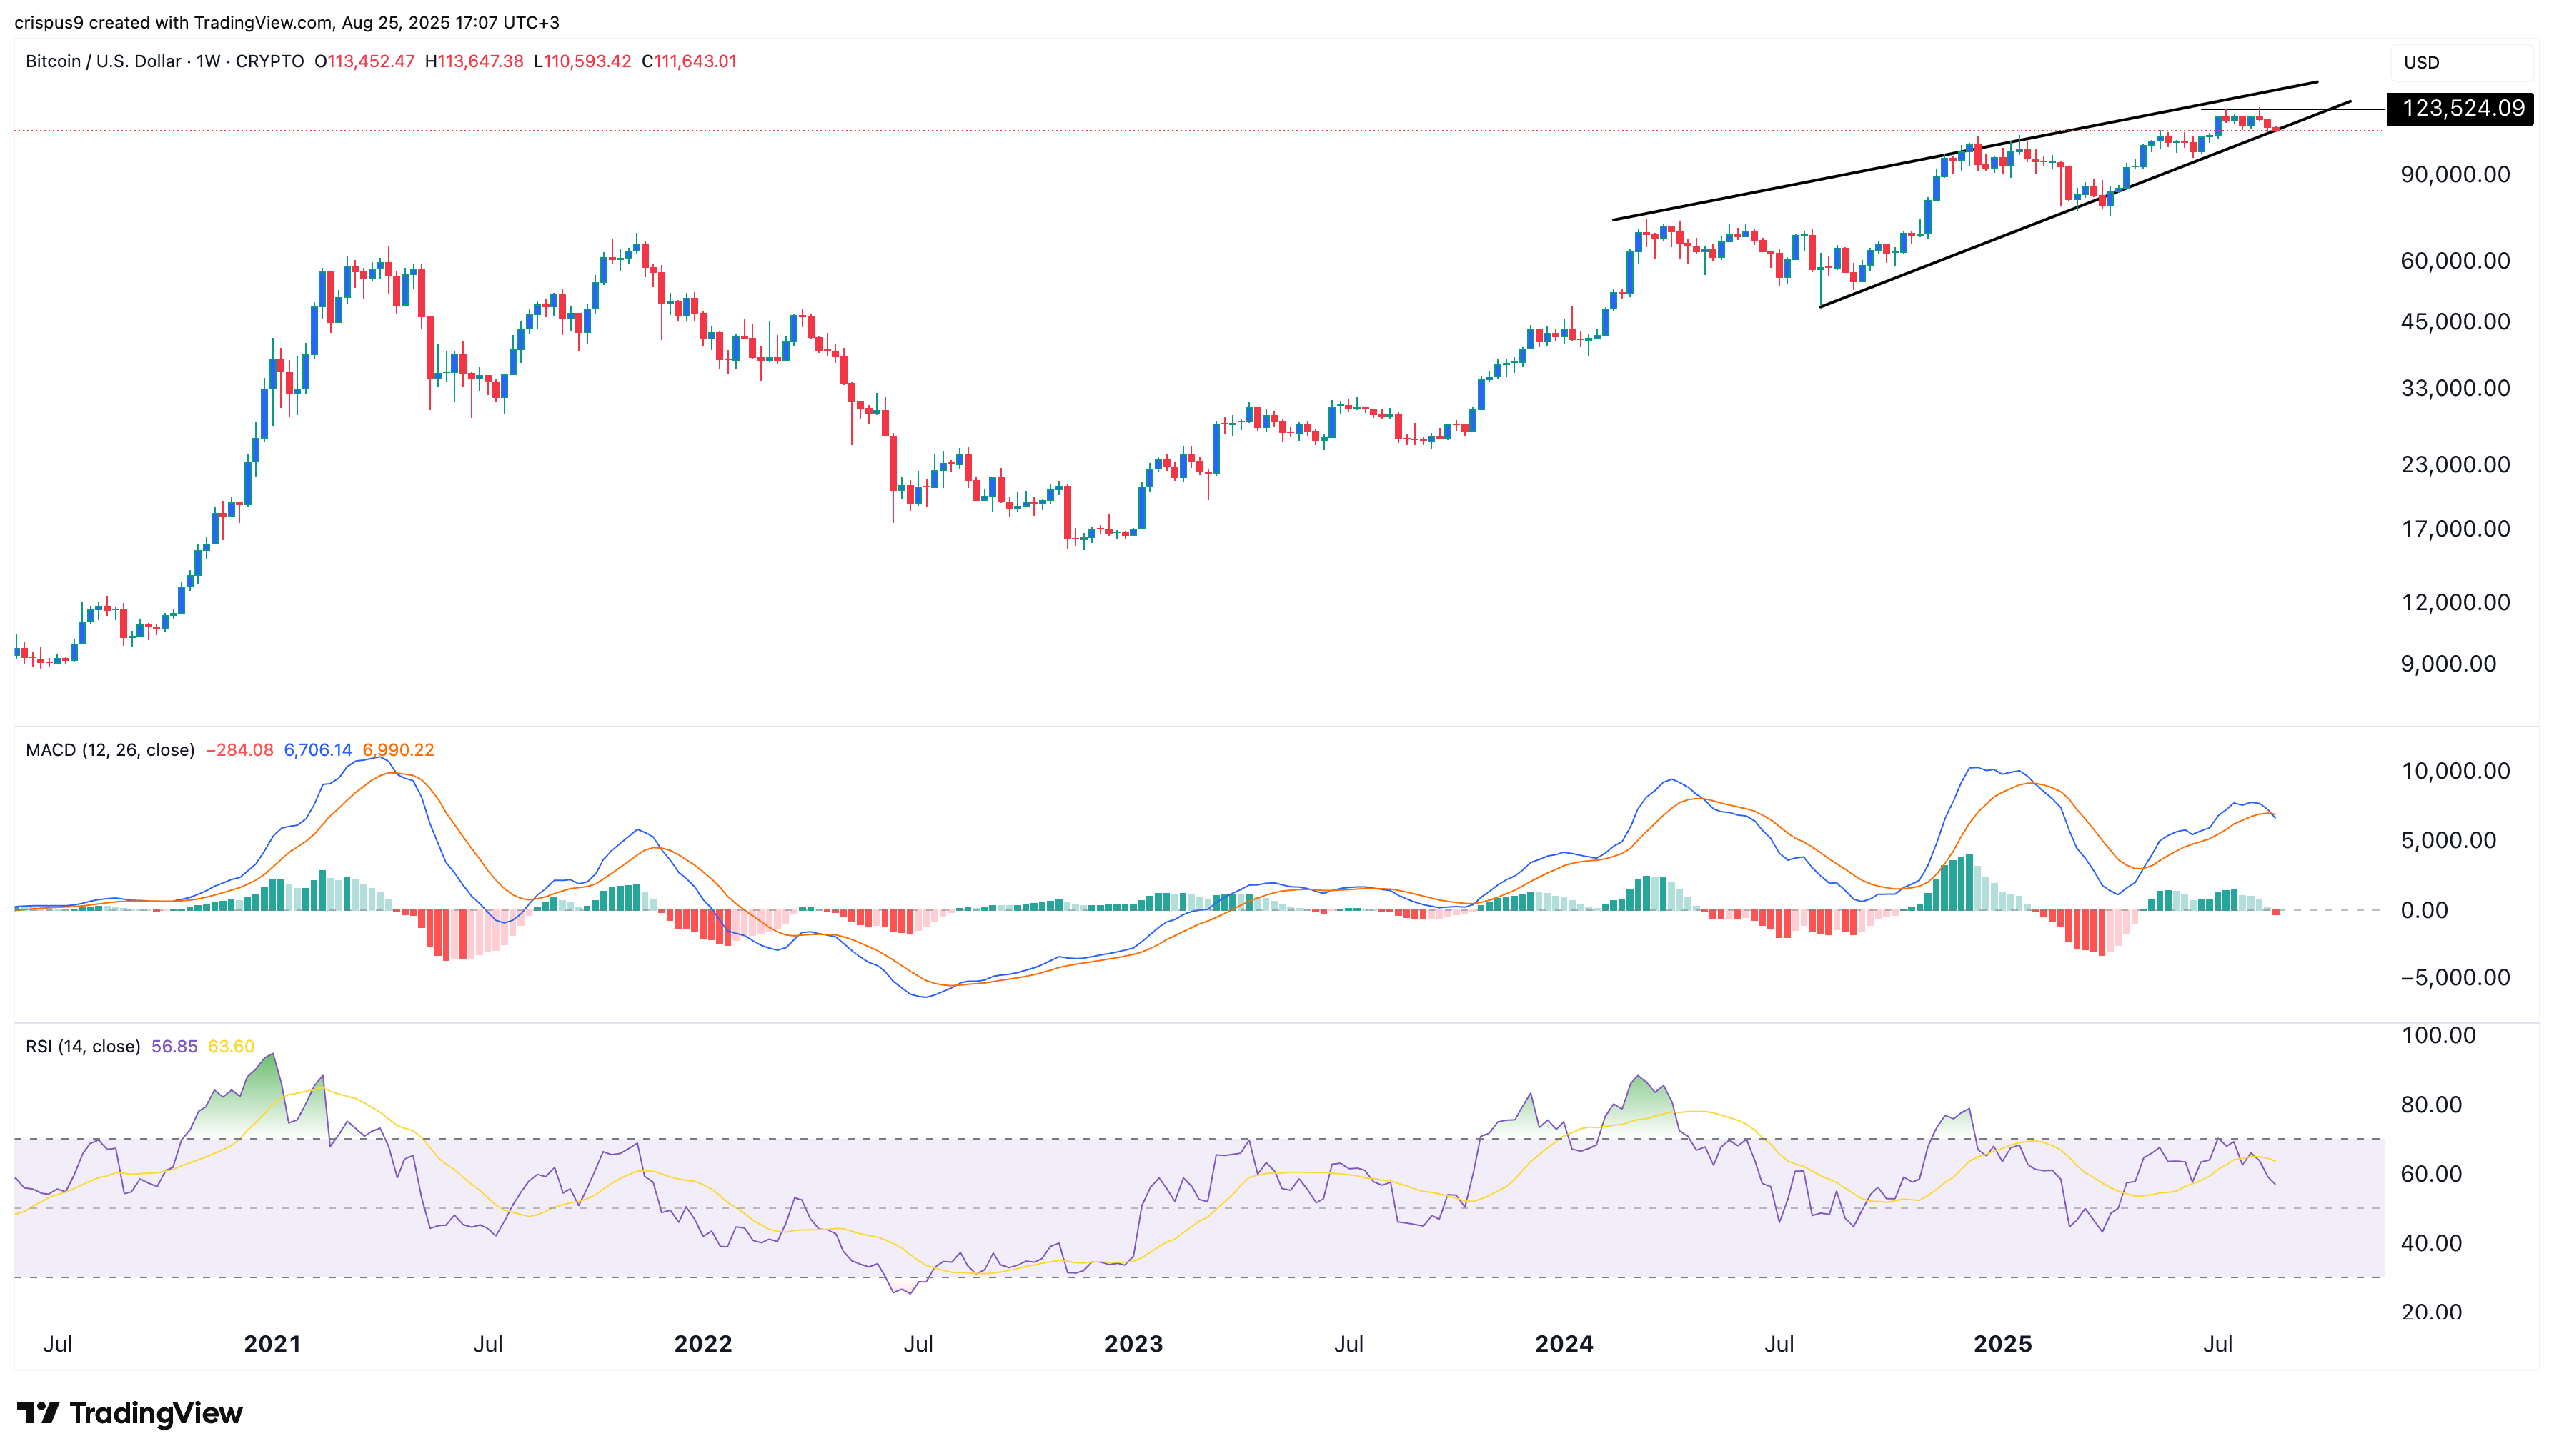
Bitcoin price has also formed a small double-top pattern at $123,500. It also formed a bearish divergence pattern as the Relative Strength Index and the MACD indicators have continued falling despite the recent crypto market rally.
Source link