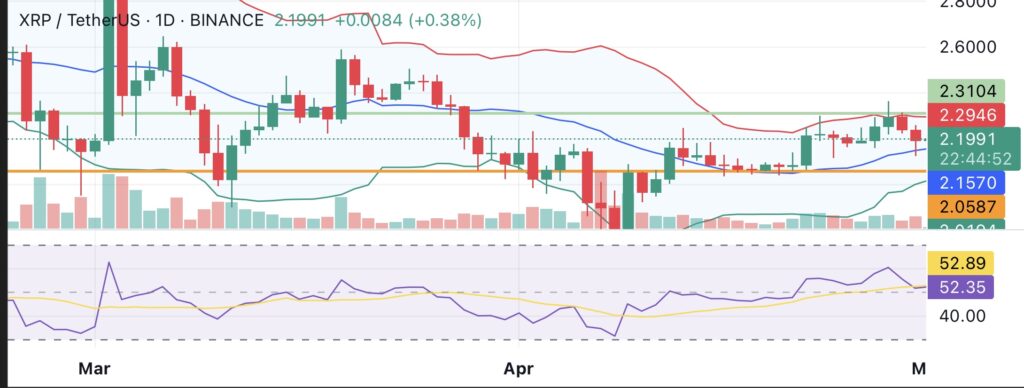
XRP’s price briefly dropped to a low of $2.15 on Apr. 30, sparking a major bias in liquidations.
According to Coinglass data, $13.9 million in long positions were liquidated in just 24 hours, compared to only $1.49 million in shorts, a nearly 1000% imbalance. This kind of imbalance shows that traders have a strong long bias.
When prices decline, too many long positions can be quickly wiped out, which is what happened in this case, causing a quick cascade that drove prices even lower. Additionally, open interest fell by 4%, indicating that many traders were exiting positions.
Despite this, XRP (XRP) has since recovered to a crucial psychological support level of about $2.20. According to some traders, this was a “flush,” removing weak hands ahead of a possible reversal. Others fear that if prices decline again, the long bias may result in additional liquidations and capitulation.
This drop came at a surprising time when many traders are expecting sustained upward momentum. XRP has seen strong progress so far this year. The Securities and Exchange Commission recently paused its appeal against Ripple, paving the way for the company to potentially work with U.S. banks again in the near future.
Ripple also launched a new stablecoin, RLUSD, which has gained significant interest, crossing $300 million in market cap. Moreover, over ten firms have applied for XRP spot exchange-traded funds, with analysts forecasting 80% or higher odds of approval. Another catalyst that might eventually increase the volume of the XRP Ledger is Ripple’s acquisition of Hidden Road, a broker that moves more than $10 billion daily.
On the technical side, the asset is trading in a tight range with no strong momentum in either direction, making the $2.15 and $2.30 levels critical to watch in the near term. Most technical indicators currently reflect a neutral outlook. With a relative strength index of 52.47, there is no discernible trend.

However, there appears to be a slight bullish bias as indicated by the moving average convergence divergence indicators, which are pointing slightly upward. While longer-term averages paint a mixed picture, shorter-term estimated moving averages (10, 20, 30) are in buy territory. The 200-day SMA and EMA are bullish and provide support at about $2.00.
If XRP manages to stay above the $2.15–$2.20 range and breaks above $2.30, it could signal a shift toward a bullish trend. This would align with recent developments that favor Ripple. On the downside, failure to hold above $2.15 could lead to another round of long liquidations. Many traders are still highly leveraged, as shown by the current imbalance, which leaves the market vulnerable to sudden drops.

Source link

